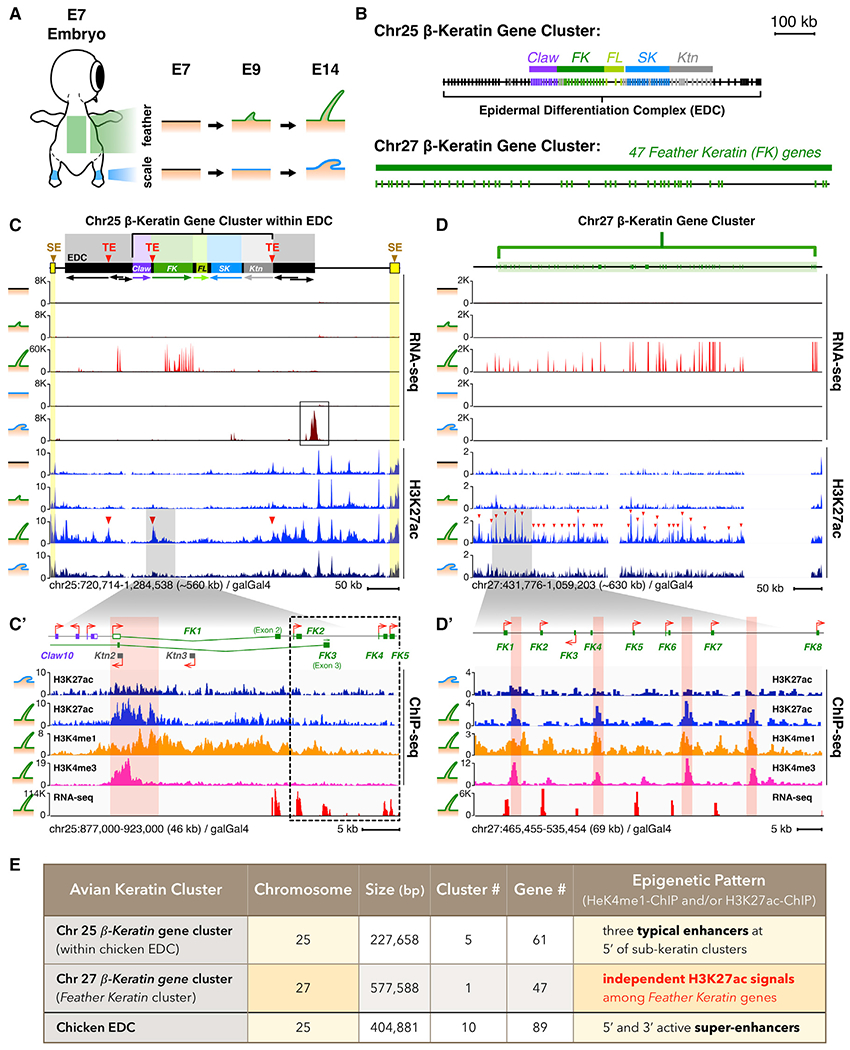
Figure 1. Distinct Transcription and Epigenetic Landscapes of Avian β-keratin Gene Clusters in Skin Regional Specification.

(A) Schematic of different avian skin developmental stages used in the study. Embryonic tissue stages were taken from feather (green) and scale producing (blue) regions (E7, E9, and E14). Short vertical lines represent individual clustered genes.
(B) Schematic of two major avian β-krt clusters on Chr25 and Chr27. Chr25 β-krt cluster contains five subclusters located within the chicken epidermal differentiation complex (EDC). FK, feather Krt; FL, feather-like; SK, scale Krt; Ktn, keratinocyte Krt. Arrows under subclusters represent orientations of the subclusters based on the general orientation of clustered genes. →, sense; ←, antisense.
(C) y axis of RNA-seq tracks represents normalized read coverages of 1 × sequencing depth (RPGC). y axis of H3K27ac tracks represents a linear scale fold enrichment (FE) of ChIP-enriched/input genomic DNA signal intensity. The yellow boxes represent super-enhancers (SE) analyzed by HOMER using ChIP-seq against H3K27ac and H3K4me1 marks.
(C′) Enlargement of the FK gene subcluster and atypical enhancer (TE; red triangles) at its 5′ end.
(D) Profiles of RNA-seq and H3K27ac marks on Chr27 β-krt cluster during embryonic skin patterning. Red triangles indicate H3K27ac peaks.
(D′) A closer look at the 5′-end of the Chr27 β-krt cluster.
(E) Summary of epigenetic landscapes and basic information of β-krt clusters.
