
Figure 6. Functional Evaluation of the Three-Factor Hypothesis for Region-Specific β-Keratin Expression.
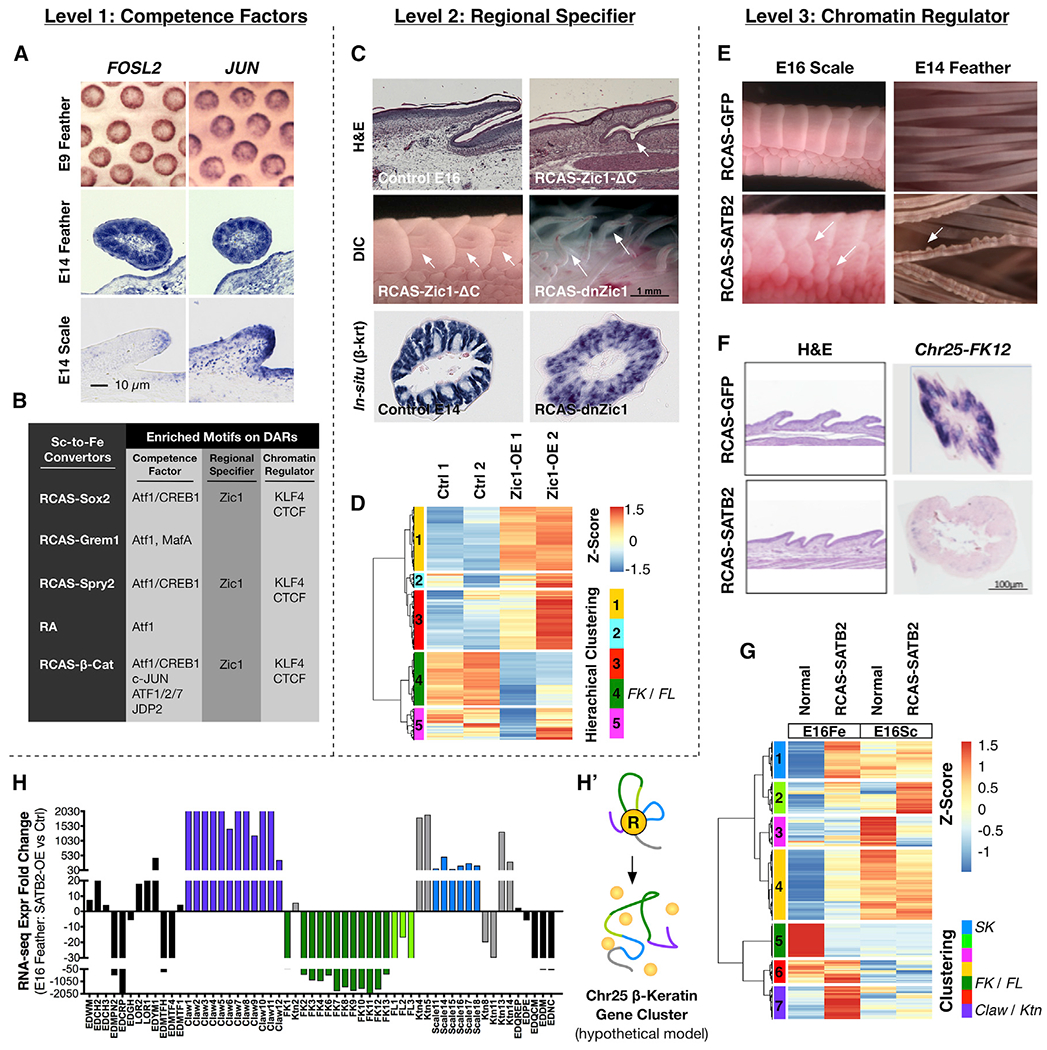
(A) ISH of FOSL2 and JUN genes at E9 and E14 feathers and scales.
(B) A summary table showing enriched motifs of the three factors on DARs under scale-to-feather conversion.
(C) Expression of a constitutively active form (RCAS-Zic1-ΔC) induced invagination in the scale hinge region, and barb ridge-like invaginations on the scale surface; both are seen in scale-to-feather transition. A dominant-negative form of Zic1 (RCAS-dnZic1) led to deformed feather filaments accompanied by disrupted β-krt expression.
(D) Normalized expression of DEGs from E14 RCAS-Zic1-infected feathers compared to its control groups. Z score, [RPKM-(mean RPKM)/standard deviation]. The DEGs were further clustered based on similarities of their expression patterns. Hierarchical Cluster 4 (green) includes FK genes.
(E) Over-expression of SATB2 in chick E14 and E16 embryos led to irregular scale formation and abnormal beaded structures in feather filaments.
(F) Aberrant Krt gene expression in irregularly sized scales after ectopic SATB2 expression. ISH shows Chr25-FK12 disappears from feather filaments.
(G) Normalized expression of DEGs from E16 RCAS-SATB2-infected feather (E16Fe) and scale epidermis (E16Sc) compared to their control groups. DEGs were further clustered by expression pattern similarities. Hierarchical Cluster 1 (blue) includes Scale Krt (SK) genes; Hierarchical Cluster 5 (green) includes FK and Feather-Like Krt (FL) genes; Hierarchical Cluster 6 (purple) includes Claw and keratinocyte (Ktn) Krt genes.
(H) EDC gene and β-krt gene fold-changes after misexpression of SATB2.
(H′) A hypothetical schematic showing disruption of the Chr25 β-krt cluster chromatin structure after SATB2 misexpression.