
Figure 3.
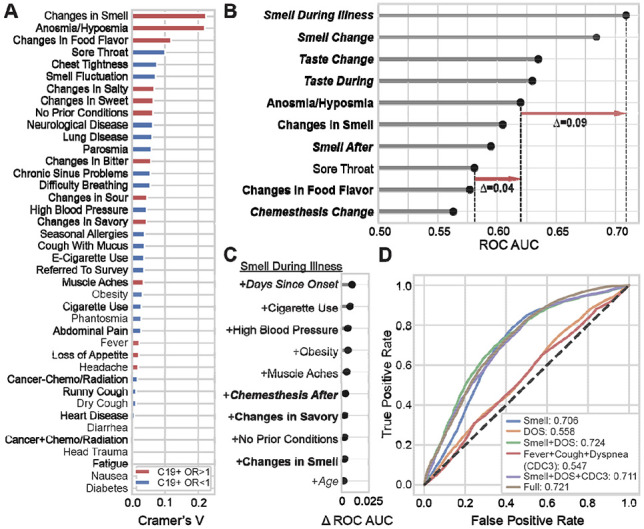
Smell loss is the strongest predictor of COVID-19 status. (A) A normalized measure of association (Cramer’s V) between binary or categorical responses on COVID-19 status. V=0 reflects no association between the response and COVID-19 status; V=1 reflects a perfect association; V>0.1 is considered a meaningful association. Features in red are positively associated with C19+ (odds ratio > 1); features in blue are negatively associated with C19+ (odds ratio < 1). (B) Logistic regression is used to predict COVID-19 status from individual features. Top-10 single features are ranked by performance (cross-validated area under the ROC curve, AUC). Chemosensory-related features (bold) show greater predictive accuracy than non-chemosensory features (non-bold). Responses provided on the numeric scale (italic) were more informative than binary responses (non-italic). Red arrows indicate differences in prediction quality (in AUC) between features. (C) Adding features to “Smell During Illness” results in little improvement to the model; only Days Since Onset of Respiratory Symptoms (DOS) yields meaningful improvement. (D) ROC curves for several models. A model using “Smell during illness” (Smell Only, abbreviated “Smell” in figure) is compared against models containing this feature along with DOS, as well as models including the three cardinal CDC features (fever, dry cough, difficulty breathing). “Full” indicates a regularized model fit using 70 dozen survey features, which achieves prediction accuracy similar to the parsimonious model “Smell Only+DOS”.