. 2020 Jul 17;5(4):e074. doi: 10.1097/j.pbj.0000000000000074
Copyright © 2020 The Authors. Published by Wolters Kluwer Health, Inc. on behalf of PBJ-Associação Porto Biomedical/Porto Biomedical Society. All rights reserved.
This is an open access article distributed under the terms of the Creative Commons Attribution-Non Commercial-No Derivatives License 4.0 (CCBY-NC-ND), where it is permissible to download and share the work provided it is properly cited. The work cannot be changed in any way or used commercially without permission from the journal. http://creativecommons.org/licenses/by-nc-nd/4.0
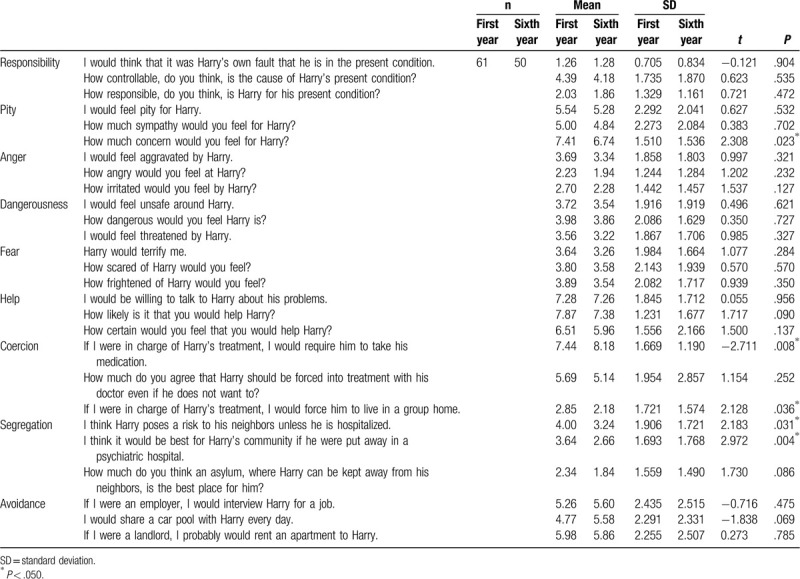
Table 3.
Comparison of means using T test accordingly to the year of studies related to each item of AQ-27

