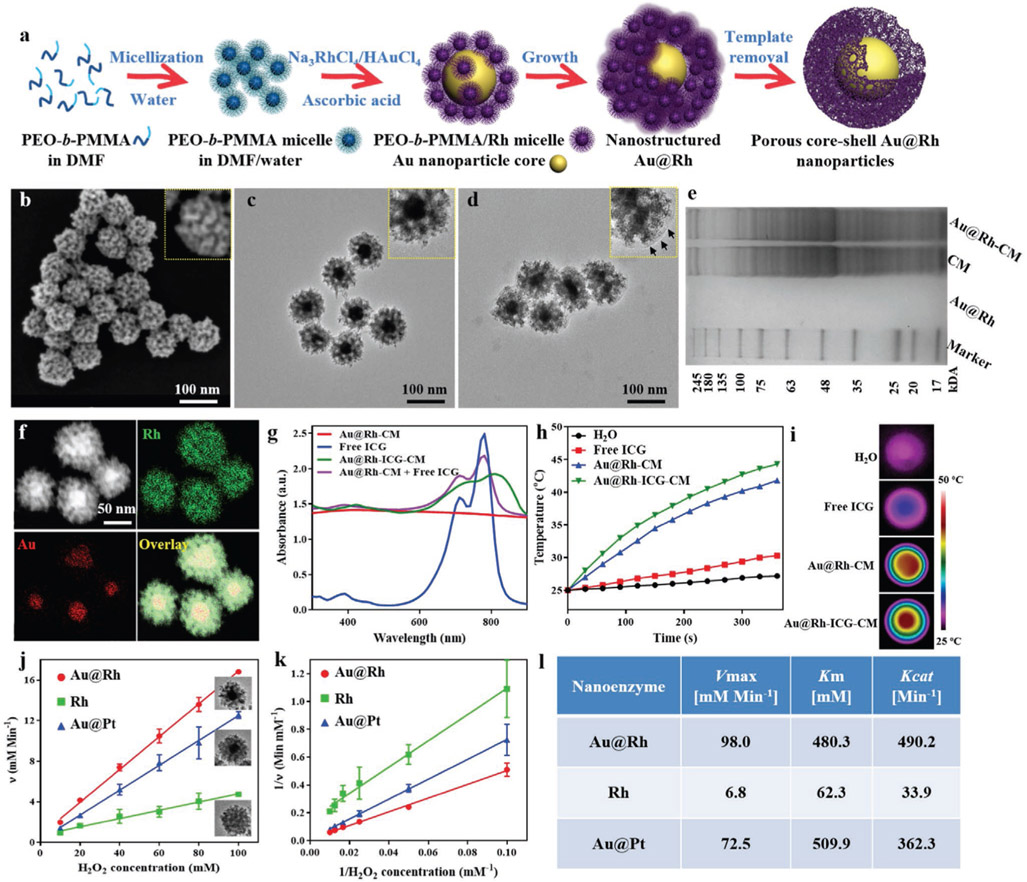
Figure 1.
a) Schematic illustration of the processes in formation of porous Au@Rh core–shell nanostructures. b) Representative SEM image of the surfaces of as-prepared Au@Rh nanostructures to show the presence of mesopores. c) Representative TEM images of Au@Rh nanostructures to confirm the existence of a dense core and porous shell in individual nanostructures. d) Representative TEM images of Au@Rh-CM nanostructures to confirm the presence of cell membrane on the nanostructure surface. Au@Rh-CM nanostructures were stained with uranyl acetate to increase the contrast of cell membrane (arrows in inset). e) SDS-PAGE protein analysis of Au@Rh, CM, and Au@Rh-CM. f) STEM-HAADF image and corresponding EDS elemental mapping of Au and Rh of Au@Rh nanostructures. g) UV–vis–NIR absorption spectra of Au@Rh-CM, free ICG, Au@Rh-ICG-CM, and the physically mixed Au@Rh-CM and free ICG. h) Heating curves of free ICG, Au@Rh-CM, and Au@Rh-ICG-CM compared to DI water only under 808-nm laser irradiation (0.3 W cm−2). i) Photothermal images of DI water, free ICG, Au@Rh-CM, and Au@Rh-ICG-CM under 808-nm laser irradiation (0.3 W cm−2, 360 s). j) The velocity of the catalytic reaction was measured using different nanostructures and different concentrations of H2O2. Inset is TEM image of the corresponding nanostructures. Data are expressed as mean ± SD (n = 3). k) Double-reciprocal plots to determine the kinetic constants of three types of nanostructures for H2O2 substrate. Data are expressed as mean ± SD (n = 3). l) Comparison of the kinetic parameters of various nanostructures toward H2O2.

