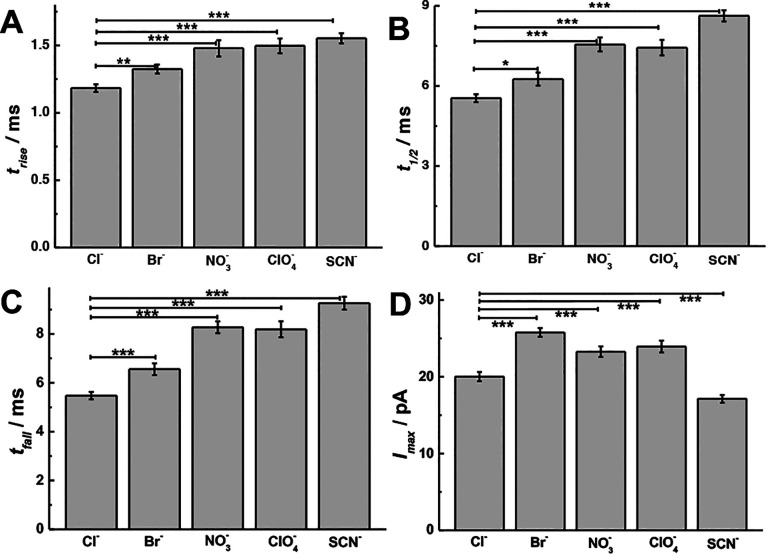
Figure 2.
Scheme showing the peak analysis, comparisons of (A) trise, (B) t1/2, (C) tfall, and (D) Imax from SCA with chromaffin cells (n = 30) stimulated by 30 mM K+ including different counteranions (e.g., Cl–, Br–, NO3–, ClO4–, and SCN–). Pairs of data sets were compared with t test; ***, p < 0.001; **, p < 0.01; *, p < 0.05.

