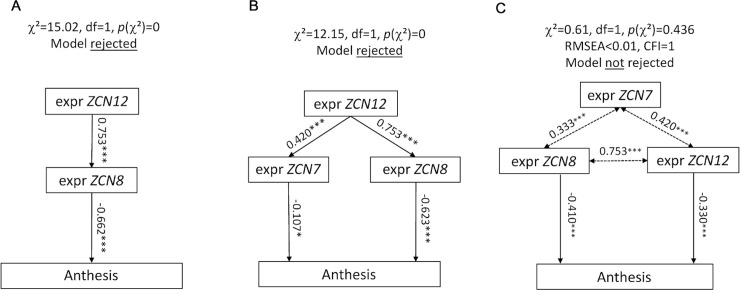
Fig 3. ZCN12 directly affects anthesis.
Three families of path diagrams were tested against the whole dataset (BLUEs, platform experiment of 2014). Models in which ZCN12 has an indirect effect on anthesis (A and B) were rejected, whereas models in which both ZCN8 and ZCN12 directly affect anthesis were accepted, with an indirect effect of ZCN7 (C). Arrows, linear functional relationships between anthesis and florigen expression. Simple-headed arrows, relationships are considered as causal by the model. Double-headed arrows, free correlations. Standardized path coefficients are indicated on each arrow with the level of significance (***: P < 0.001, ns: not significant). Other models tested are displayed in S7 Fig.

