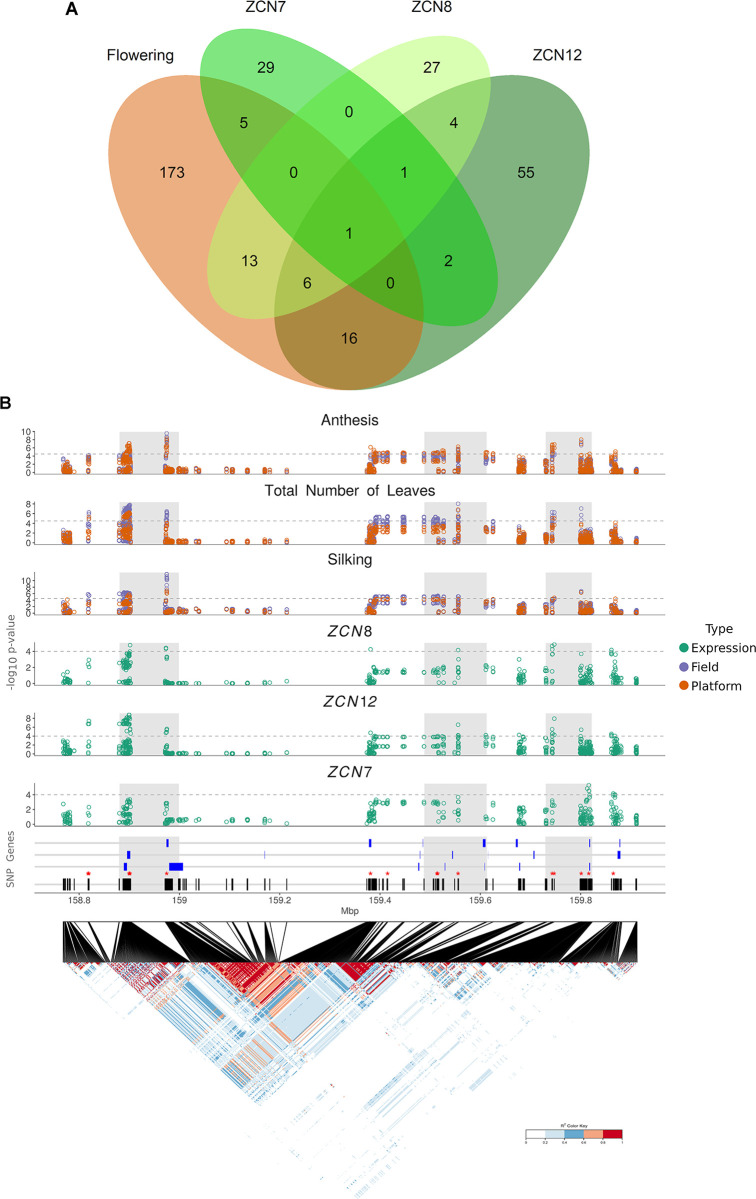
Fig 4. ZCN eQTLs are major contributors to the genetic variance of flowering time.
(A) ZCN-related QTLs overlap with flowering time QTLs. Venn diagram highlights ‘meta-QTLs’ shared among flowering-related traits and ZCN transcripts accumulation. “Flowering” meta-QTLs are defined as regions containing at least one QTL among anthesis, silking, total number of leaves in at least one experiment (platform, field, years). “ZCN-” meta-QTLs are defined as regions containing at least one ZCN- eQTL in at least one experiment (platform 2014–2015) and leaf stage. (B) Regional association plot for one meta-QTL on chromosome 3. Distribution of the -log10(pval) for all variants in the region. The dotted grey line corresponds to–log10(pval) = 4.5 for anthesis-related traits evaluated in the field (purple) and platform (orange) and 4 for the expression traits evaluated in the platform (green). (C), linkage disequilibrium (LD) heat map of all SNPs in the QTL showing the local LD (r2) between all the variants; Black lines represent the distribution of the SNPs and the blue boxes represents the genes mapped for the region. Red asterisks represent the position of the most significant SNPs. (See also S4 Table for candidate genes). Grey areas represent sub-regions harbouring the most significant SNPs and genes and having low LD between them on average.

