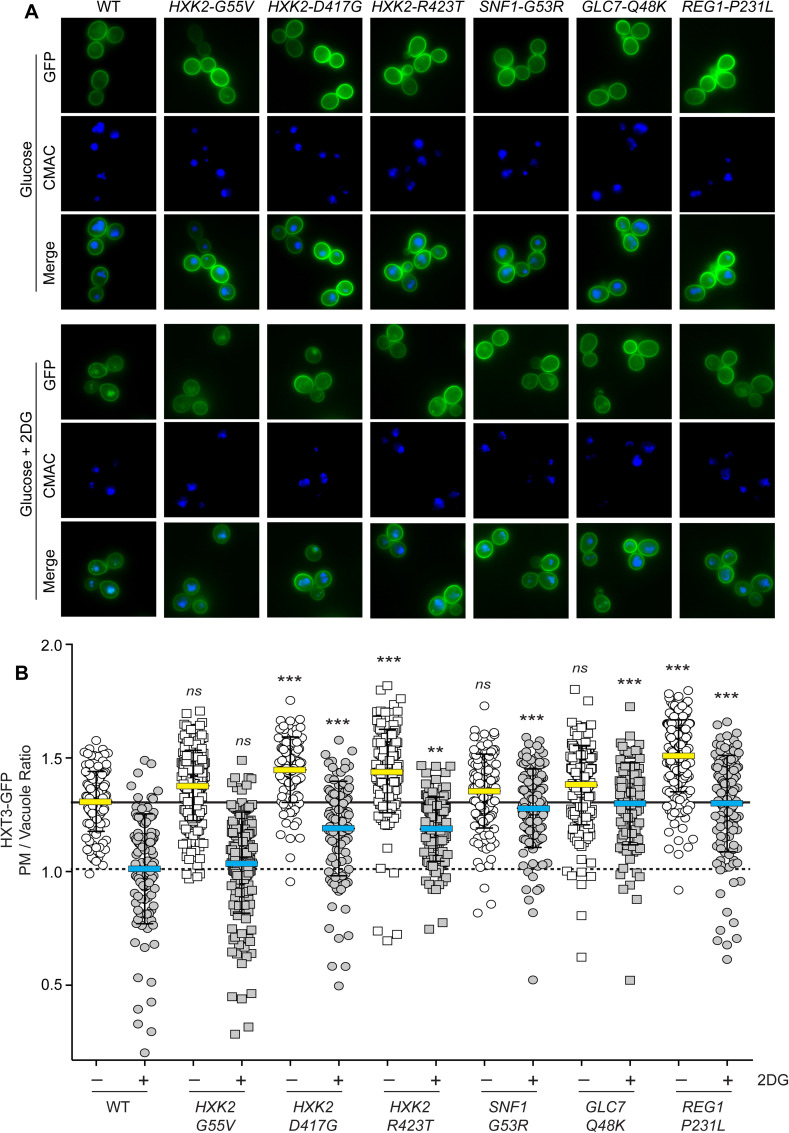
Fig 5. HXT3-GFP localization.
A. Wild-type cells (WT) or cells with the indicated mutations with integrated Hxt3-GFP were stained with CMAC blue to identify the vacuole. Images were captured during growth on glucose or two hours after addition of 2DG. B. Quantitation of GFP fluorescence for at least 150 cells is plotted for each cell as the ratio of plasma membrane (PM) fluorescence to vacuolar fluorescence. The mean value for cells grown in glucose is marked with a yellow bar with the mean value for wild-type cells indicated as a solid reference line across the graph. The mean value for cells treated with 2DG is marked with a blue bar with the mean value for wild-type cells treated with 2DG is indicated with a hashed line as a reference value across the graph. Fluorescence values statistically different from wild type, where all untreated cells are compared to untreated WT and all 2DG-treated cells are compared to the 2DG-treated WT control.

