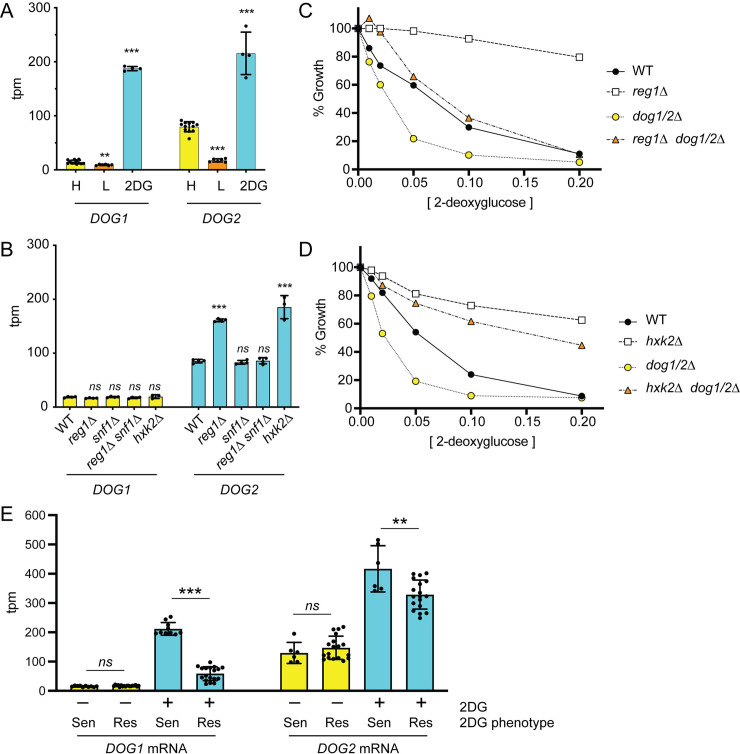
Fig 7. 2DG-resistance does not require the DOG phosphatases.
A-B. Messenger mRNA abundance for the DOG1 and DOG2 genes was measured by RNAseq in mulitple independent replicates and plotted as transcripts per million mapped reads (tpm). Values statistically different from wild type in high glucose are shown. A. RNA was isolated from cells grown in high glucose (H), two hours after shifting to 0.05% glucose (L), or two hours after addition of 2DG to a final concentration of 0.1%. B. Abundance of DOG1 and DOG2 mRNA is shown for wild-type cells, reg1Δ, snf1Δ, reg1Δ snf1Δ and hxk2Δ cells grown in high glucose. C and D. 2DG resistance assays for wild-type (WT) cells and cells with the indicated genotypes. E. Transcriptional response to 2DG was measured by RNAseq in wild type cells sensitive to 2DG (Sen) and 2DG-resistant (Res) strains (SNF1-G53R, HXK2-G55V, HXK2-D417G, GLC7-Q48K, REG1-P231L and reg1Δ). RNA was harvested in triplicate from cells grown to mid-log in 2% glucose (–) or two hours after addition of 2DG (+) as indicated. The expression level of the DOG1 and DOG2 mRNAs (tpm) is plotted with statistically significant differences indicated.

