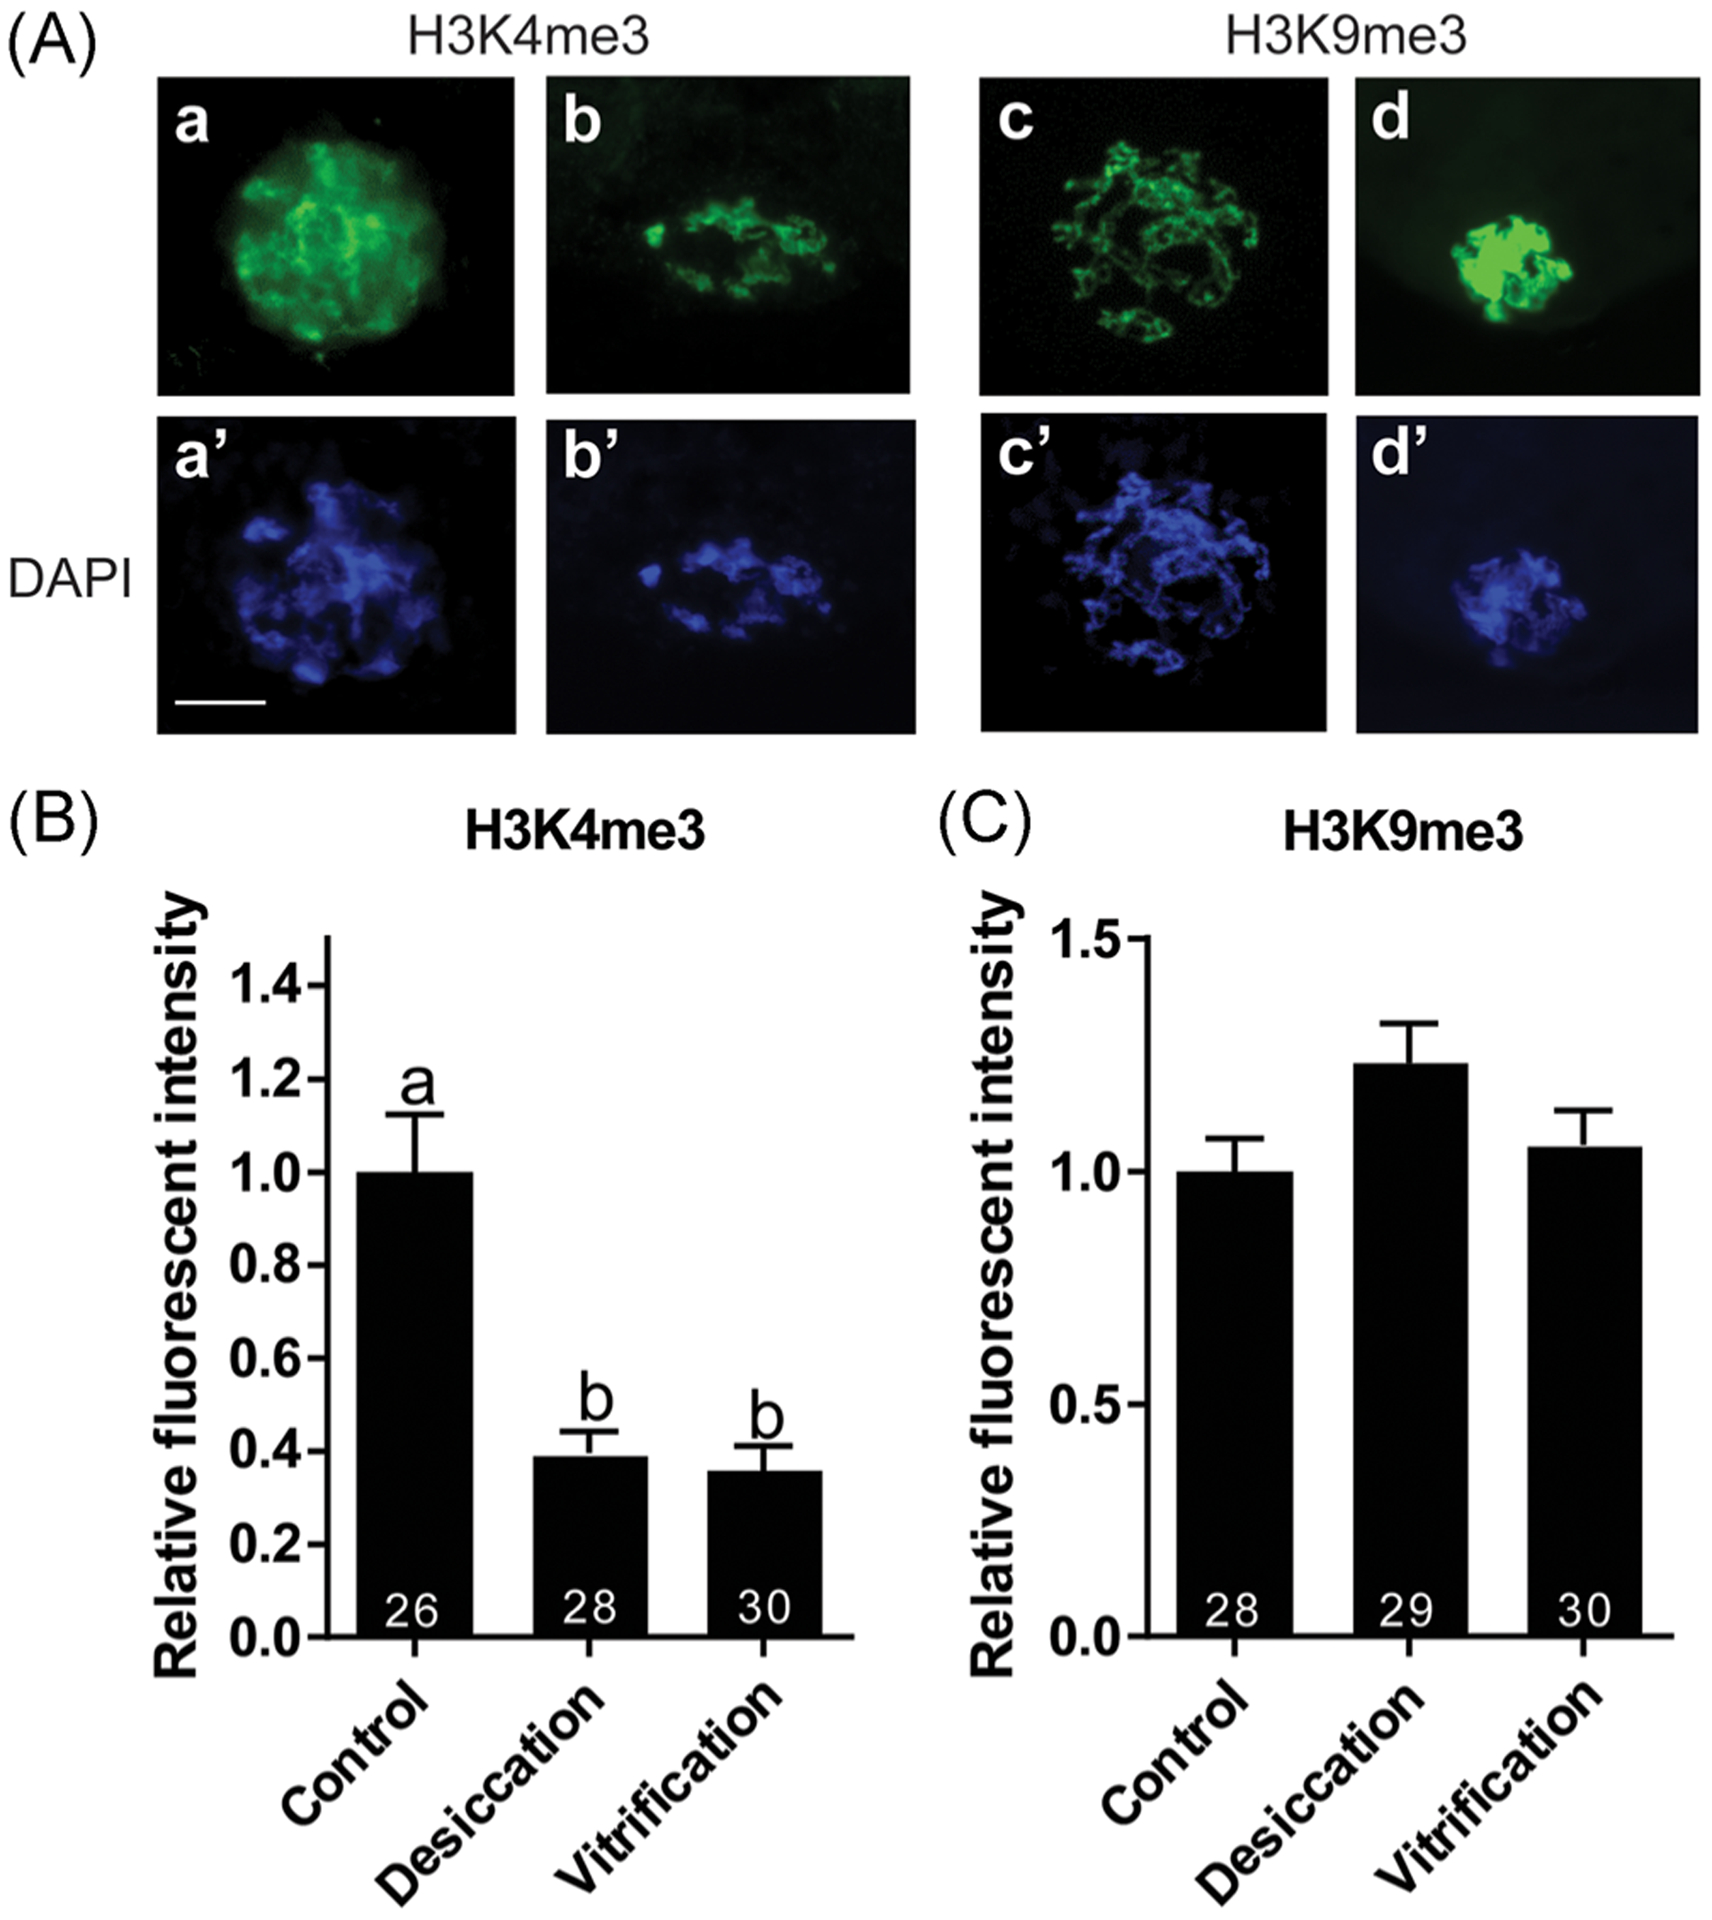
FIGURE 2.

Relative fluorescent intensity of epigenetic markers in cat GVs following desiccation or vitrification. (A) Representatives of GVs immunostained with H3K4me3 (a, b) or H3K9me3 (c, d) antibodies. Corresponding DNA was counterstained with DAPI (a’–d’). Scale bar = 20 μm. (B, C) Influence of desiccation and vitrification on the intensity of (B) H3K4me3 and (C) H3K9me3. Mean fluorescent intensity of control, untreated GVs was set as 1. Values are mean ± SEM. Values with different letters differ (p < .05). Numbers at the bottom of the bars indicate total number of oocytes in each group. GV, germinal vesicle; SEM, standard error of the mean
