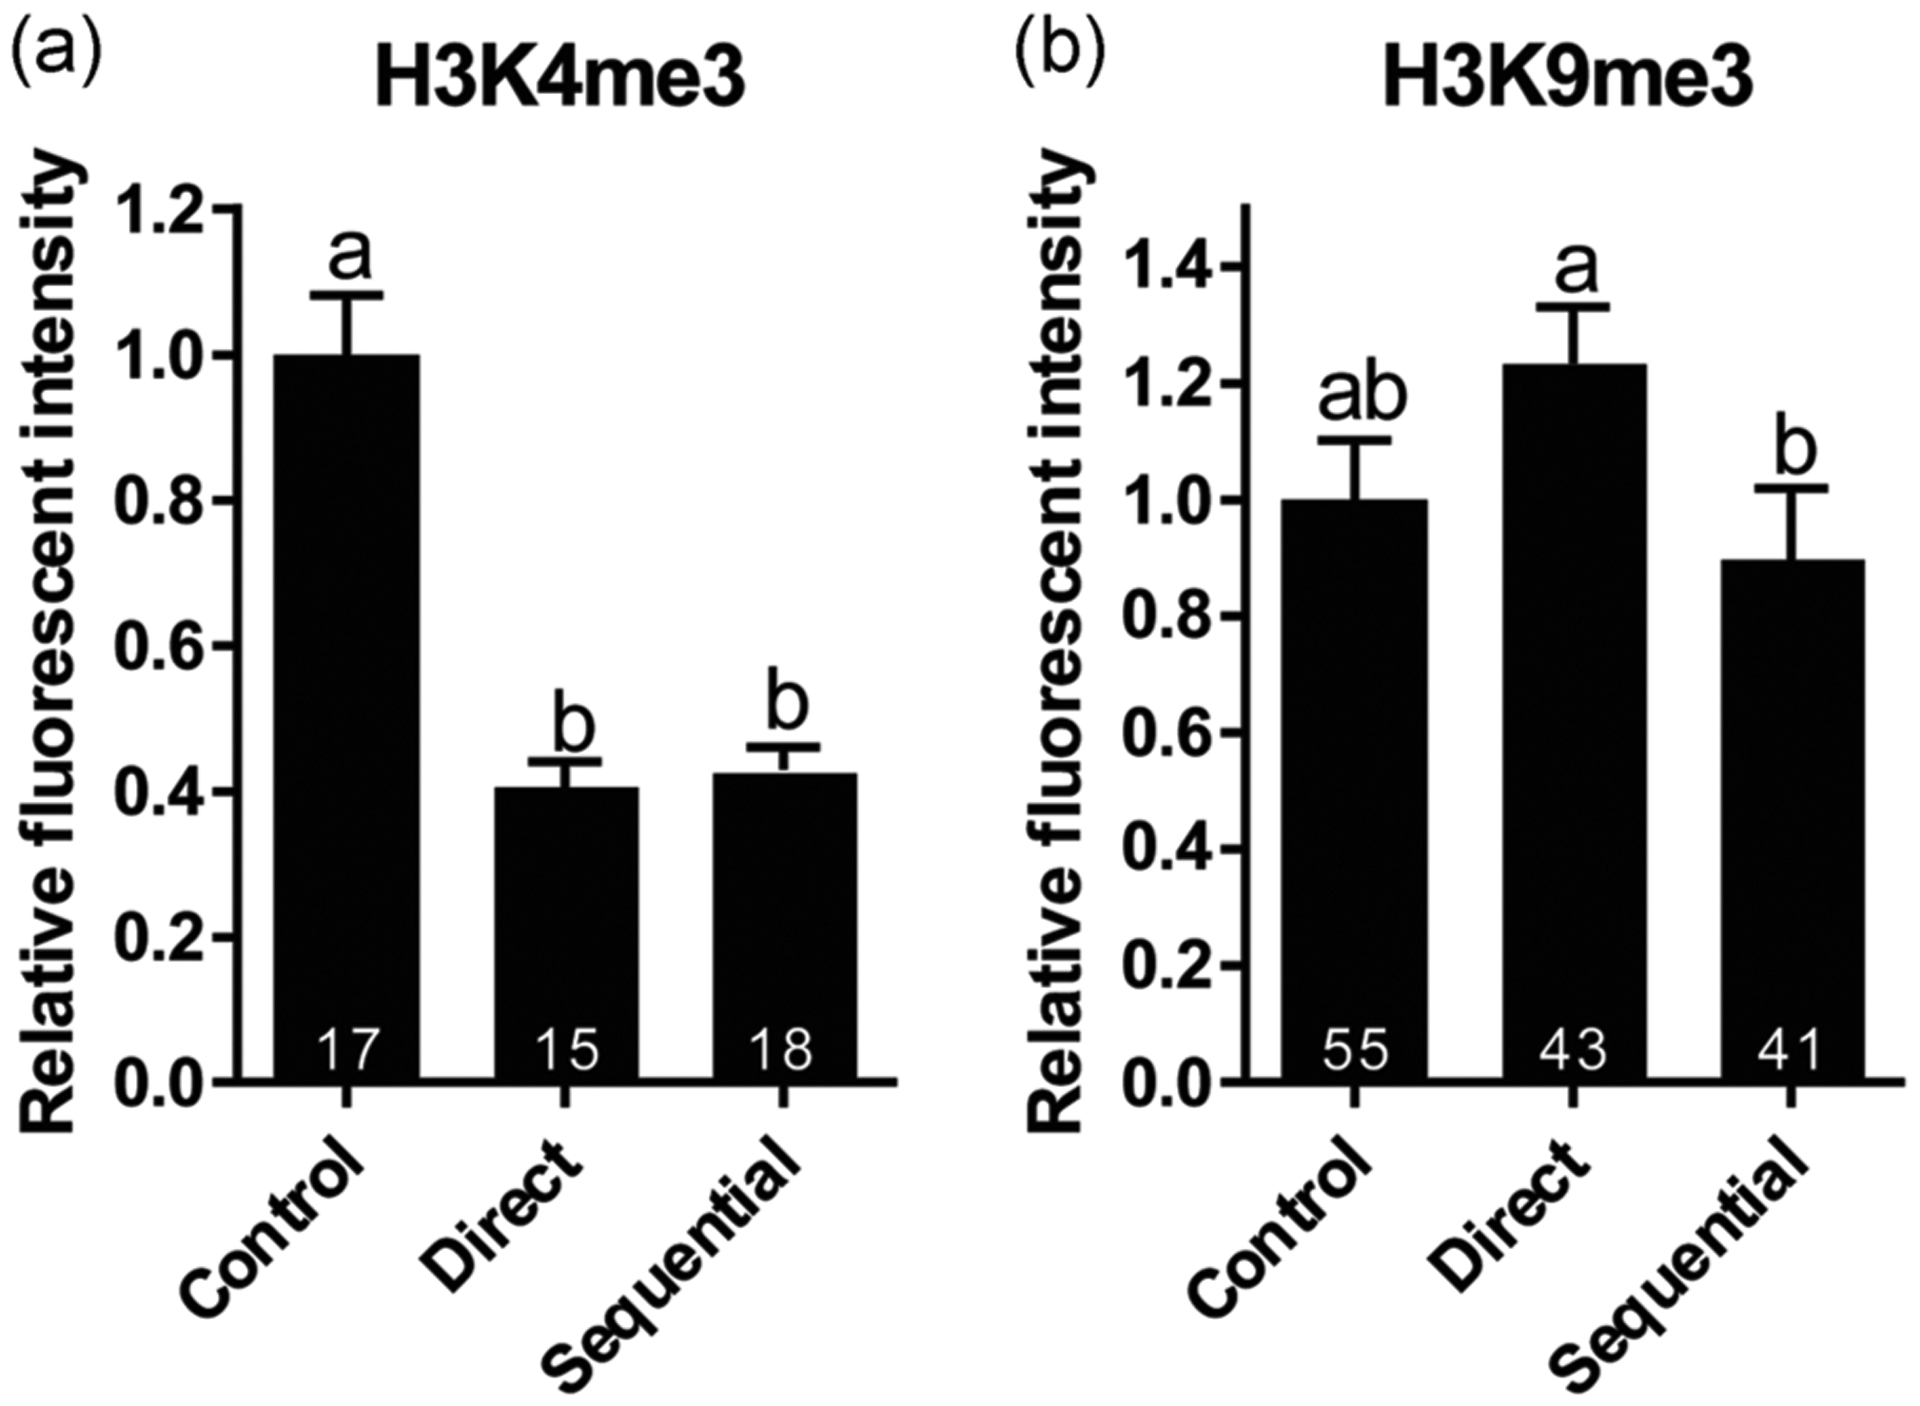
FIGURE 4.

Influence of two rehydration protocols (direct versus sequential) on the relative fluorescent intensity of epigenetic markers (a) H3K4me3 and (b) H3K9me3 in cat GVs. Mean fluorescent intensity of fresh control GVs was set as 1. Values are mean ± SEM. Values with different letters differ (p < .05). Numbers at the bottom of the bars indicate a total number of oocytes in each group. GV, germinal vesicle; SEM, standard error of the mean
