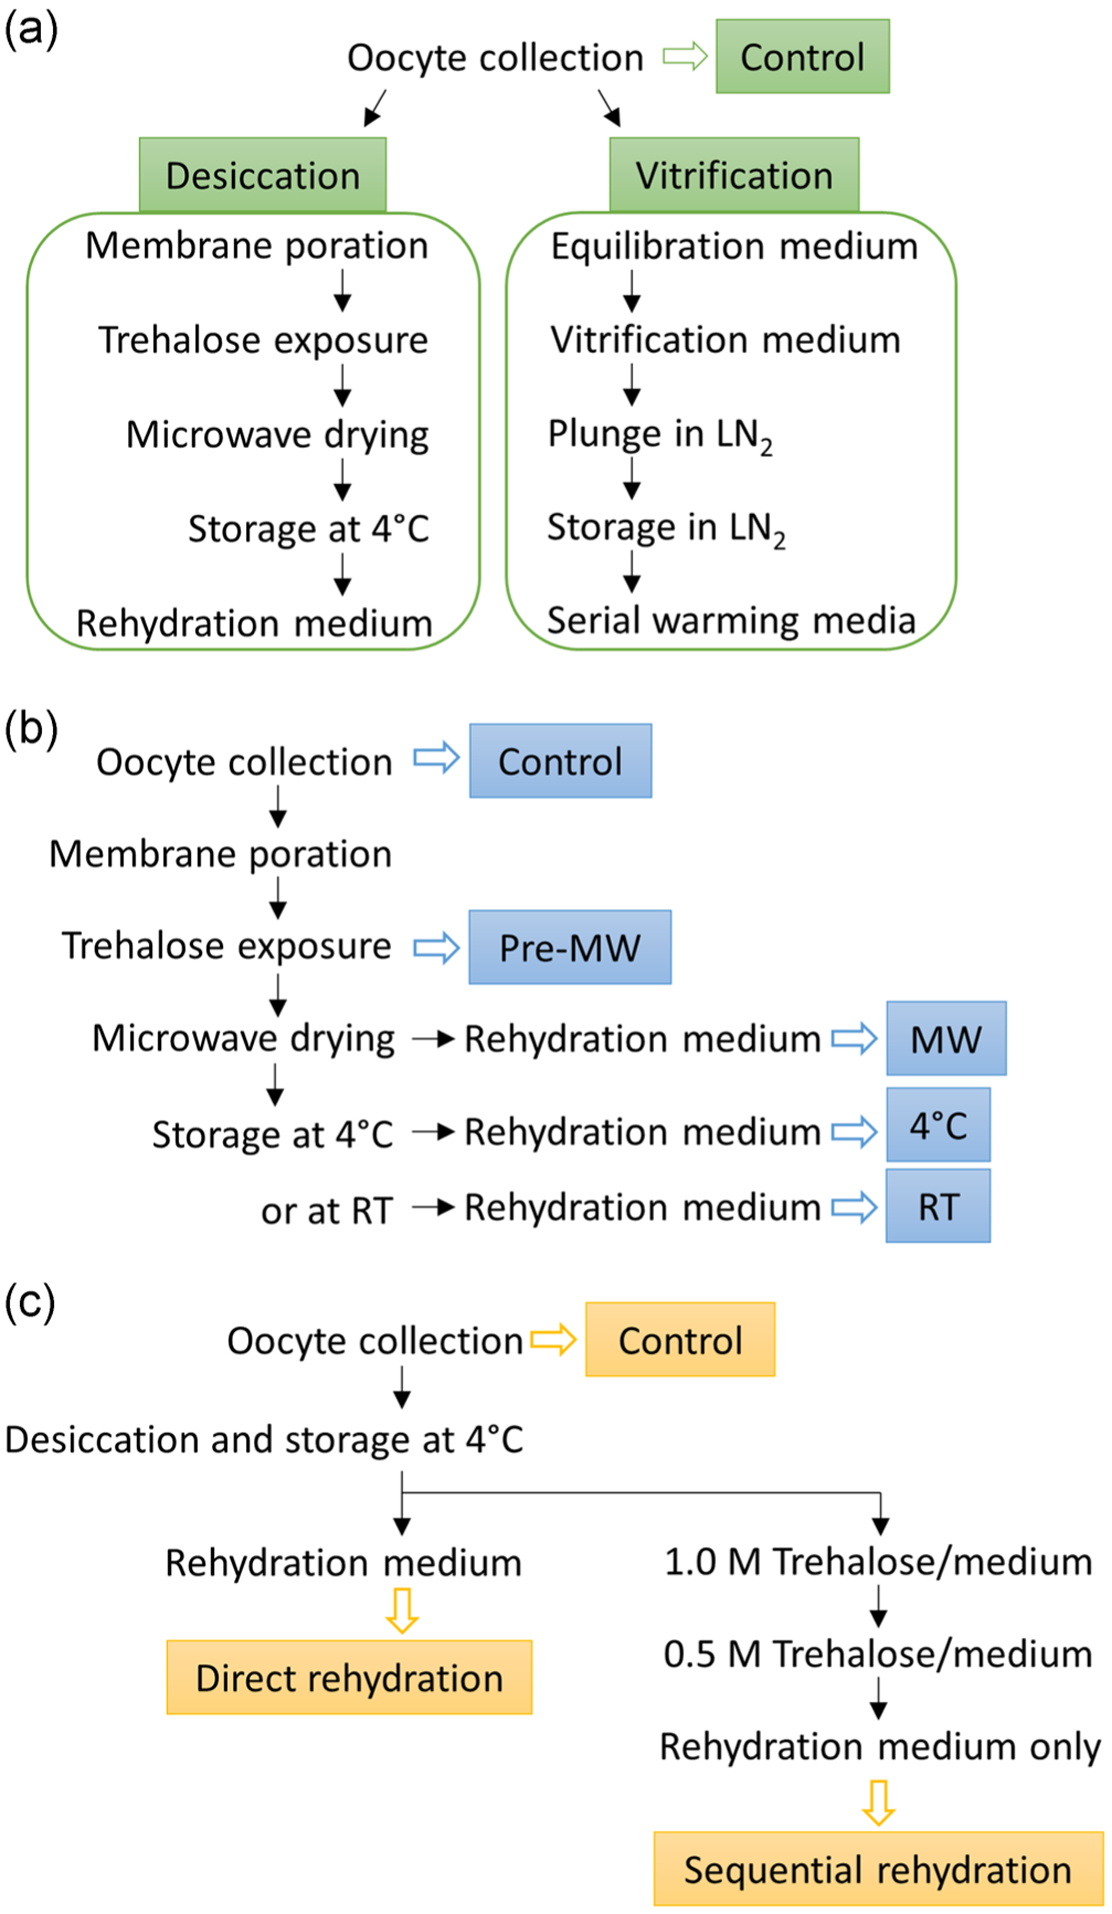
FIGURE 5.

Flow charts for (a) Experiment 1, (b) Experiment 2, and (c) Experiment 3. Open arrows indicate samples collected at the end of the procedure and boxed texts indicate the names of the treatment groups. MW, microwave drying. RT, room temperature
