
FIGURE 2.
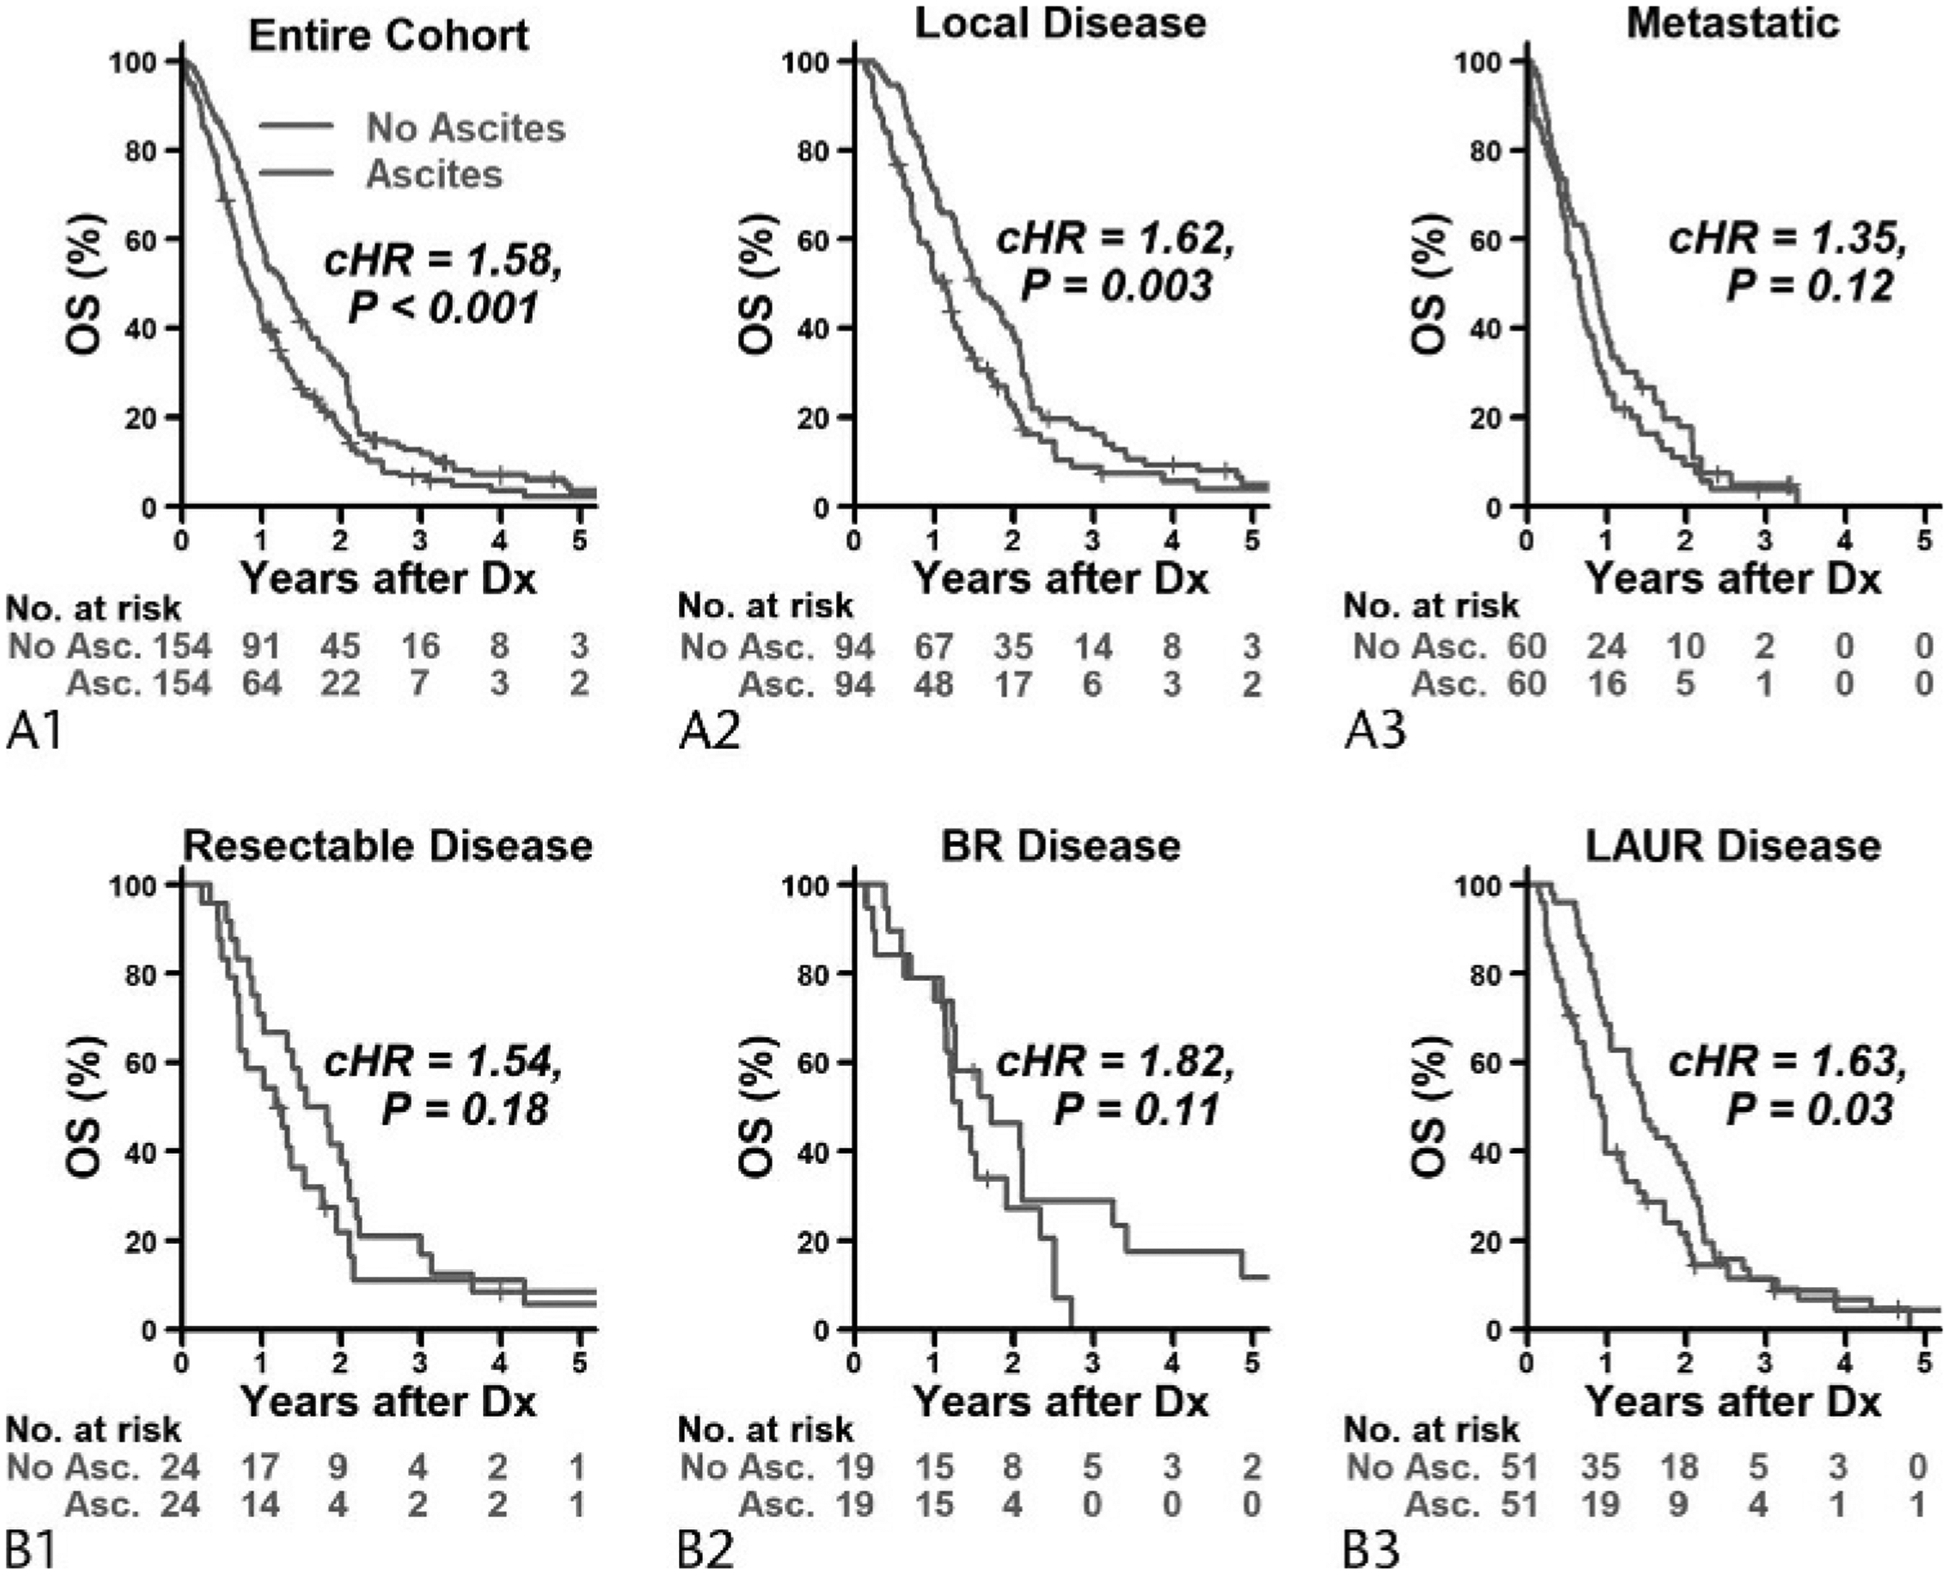
Kaplan-Meier curves for OS by ascites status in the entire cohort (A1) and within patients who had local disease (A2) and metastatic disease (A3); B, within patients who had resectable disease (B1), BR disease (B2), and LAUR disease (B3). Curves were truncated at 5 years because we had a total of only 5 patients who followed up for more than 5 years. Asc indicates ascites; Dx, diagnosis.