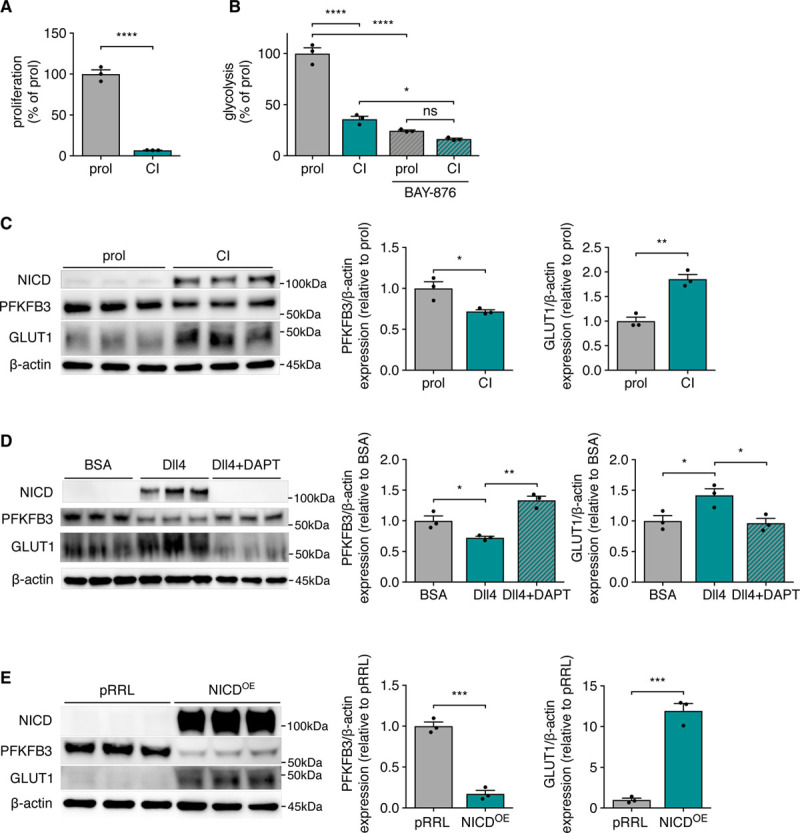
Figure 2.

GLUT1 (glucose transporter isoform 1) expression is increased in quiescence and uncoupled from glycolysis. A, Proliferation rate of proliferating (prol) and contact inhibited (CI) human umbilical vein ECs (HUVECs; Student t test). B, Glycolytic flux in proliferating (prol) and contact inhibited (CI) HUVECs incubated with 20 nmol/L BAY-876 (N4-[1-[(4-cyanophenyl)methyl]-5-methyl-3-(trifluoromethyl)-1H-pyrazol-4-yl]-7-fluoro-2,4-quinolinedicarboxamide) vs control (2-way ANOVA and Tukey multiple comparisons test). C, Representative image and quantification of Western blot of Notch intracellular domain (NICD), PFKFB3 (6-phosphofructo-2-kinase/fructose-2,6-biphosphatase 3), and GLUT1 protein levels in proliferating vs contact inhibited HUVECs. β-actin is used as loading control (Student t test). D, Representative image and quantification of Western blot of NICD, PFKFB3, and GLUT1 protein levels in HUVECs cultured on BSA or Dll4 (delta-like 4) coated plates with or without γ-secretase inhibitor N-[N-(3,5-difluorophenacetyl)-L-alanyl]-S-phenylglycine t-butyl ester (DAPT; 20 μmol/L) treatment (1-way ANOVA and Tukey multiple comparisons test). E, Representative image and quantification of Western blot of NICD, PFKFB3, and GLUT1 protein levels in HUVECs with overexpression of NICD vs empty control overexpression vector (pRRL; Student t test). All values are normalized to the control condition (C–E). *P<0.05, **P<0.01, ***P<0.001, and ****P<0.0001.
