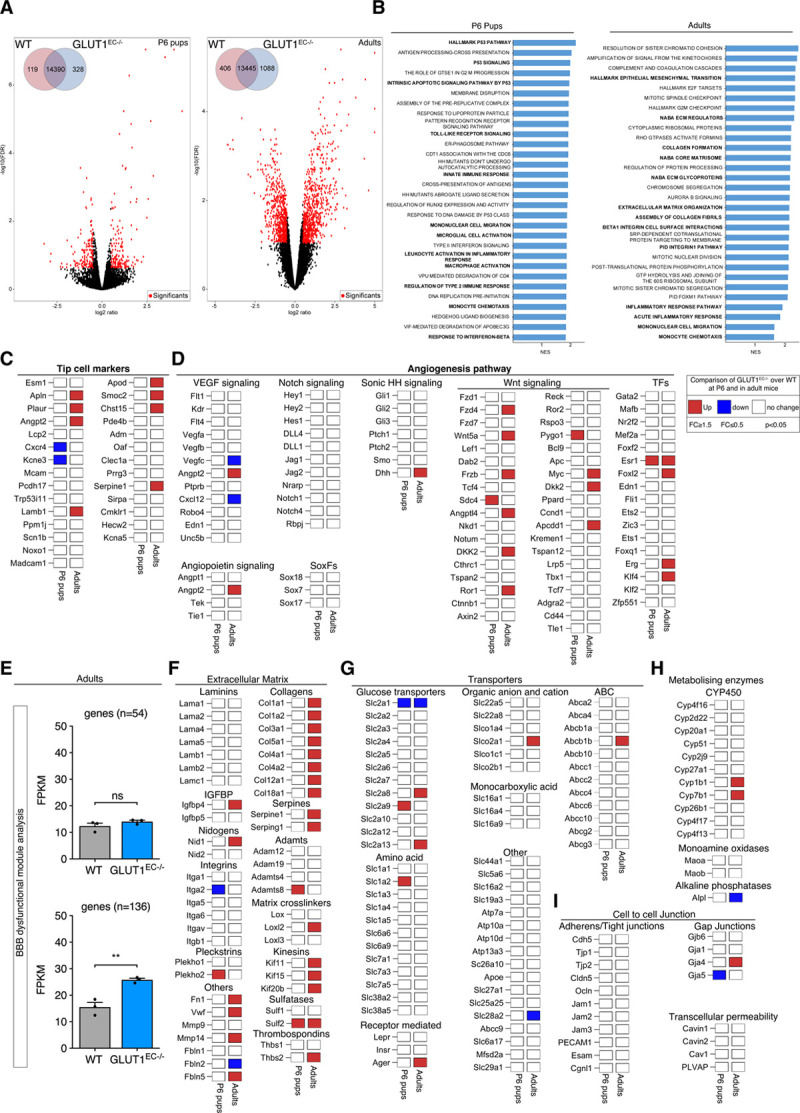
Figure 8.

Transcriptional alterations upon loss of GLUT1 (glucose transporter isoform 1) in brain endothelial cells (ECs). A, Volcano plots displaying the magnitude of the differential expression between wild-type (WT) and GLUT1EC−/− brain ECs either at P6 (left; n=4 per genotype) or in adulthood (right; n=3 per genotype). Each dot represents 1 gene that has detectable expression both in WT and GLUT1EC−/− brain ECs. Black dots represent genes that are not altered. Differentially expressed genes are labeled in red. The number of differentially expressed genes between WT and GLUT1EC−/− brain ECs is shown (inset). FDR-values were calculated using Benjamini-Hochberg method; P≤0.01, log ratio ≥0.5). B, Gene set enrichment analysis for both P6 pups (left) or adults (right) showing significantly enriched pathway ranked by normalized enrichment score (NES) and P value. Key pathways highlighted in bold include inflammatory pathways (P6 pups and adults), and p53 and extracellular matrix signaling in P6 pups and adults respectively. C and D, Differential expression for a selected set of tip cell marker genes (C) and angiogenesis related genes (D) at P6 (left column) or in adults (right column) based on criteria defined in the legend box. E, Blood-brain barrier (BBB) dysfunctional modules analysis showing the comparison of the average FPKM values of the core (n=54), as well the compiled core and adjunct (n=136) genes in WT vs GLUT1EC−/− in adulthood (Student t test). F, Differential expression patterns of extracellular matrix related genes including laminins, collagens, serpines, adamts, integrins, matrix cross linkers, and others based on criteria defined in the legend box. G, Differential expression patterns of different glucose, amino acids, monocarboxylic acid, ABC, organic anion, and cation transporters based on criteria defined in the legend box. H, Differential expression of metabolizing enzymes (CYP450, MAOs, and ALPs) implicated in BBB function based on criteria defined in the legend box. I, Differential expression patterns of adherens/tight junctions, gap junctions, and transcellular permeability genes implicated in BBB function based on criteria defined in the legend box (n=3 per genotype for adults; n=4 per genotype for P6 pups). **P<0.01.
