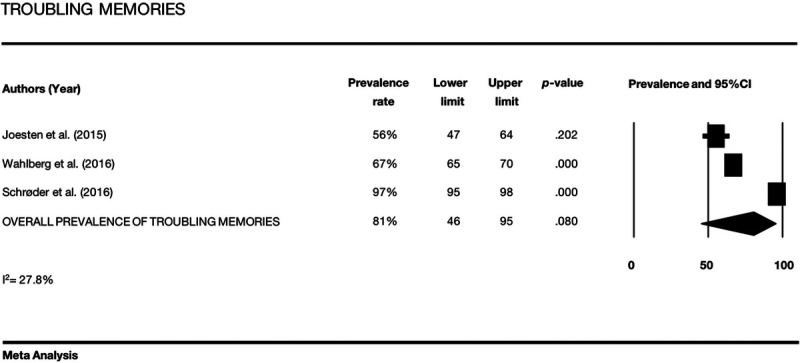
FIGURE 2.

Forest plot showing the overall prevalence of troubling memories, the prevalence rates for the primary studies, the respective 95% CI, the P values, and the I2 statistic.

Forest plot showing the overall prevalence of troubling memories, the prevalence rates for the primary studies, the respective 95% CI, the P values, and the I2 statistic.