. 2020 Jul 14;9:e53080. doi: 10.7554/eLife.53080

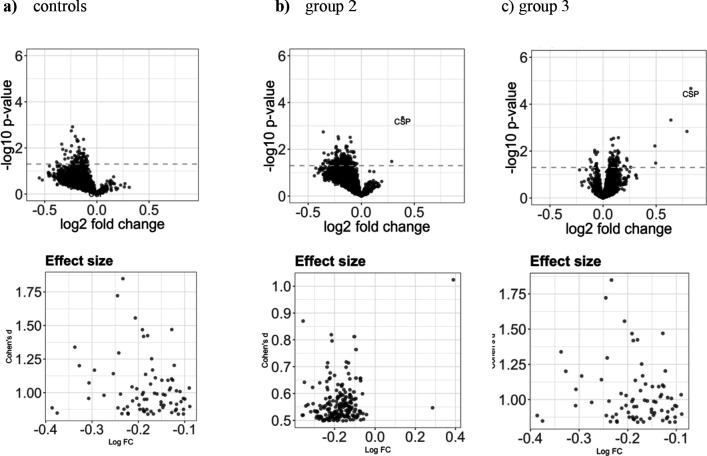
Figure 4. Increase in antigen recognition from baseline to after PfSPZ vaccination is moderate.

The three volcano plots in the upper row show (a) the mean fold change in the control group (n = 8), (b) in group 2 (1.35 × 10⁵ PfSPZ Vaccine/dose) (n = 18), and (c) in group 3 (2.7 × 10⁵ PfSPZ Vaccine/dose) (n = 20). In all groups, the samples collected at baseline and two weeks past last vaccination were compared. The dashed line represents the threshold of statistical significance (p=0.05) not adjusted for the FDR (none of the antigens had a FDR adjusted p-value<0.05). For effect size estimates see Figure 4—figure supplement 1.

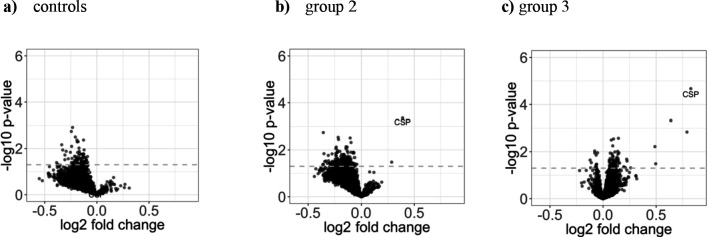
Figure 4—source data 1. Source data for plot a.
Figure 4—source data 2. Source data for plot b.
Figure 4—source data 3. Source data for plot c.

Figure 4.

Figure 4—figure supplement 1. Effect size for the increase in antigen recognition from baseline to after PfSPZ vaccination.

Figure 4—figure supplement 1.

Upper row: The three volcano plots in the upper row show (a) the mean fold change in the control group (n = 8), (b) in group 2 (n = 18), and (c) in group 3 (n = 20). In all groups, the samples collected at baseline and two weeks past last vaccination were compared. The dashed line represents the threshold of statistical significance (p=0.05) not adjusted for the FDR (none of the antigens had a FDR adjusted p-value<0.05). Lower row: for each volcano plot the corresponding effect size for all antigens with a significant (p value < 0.05) fold change is shown.
Figure 4—figure supplement 2. Differential antigen reactivity between control and immunization groups is moderate.

Figure 4—figure supplement 2.

The three volcano plots illustrate (a) the mean fold change of the differential antigen reactivity before and 2 weeks after immunization between controls (n = 8) and group 2 (n = 18), (b) between controls and group 3 (n = 20), and (c) between group 2 and group 3. The dashed line represents the threshold of statistical significance (p=0.05) not adjusted for the FDR (none of the antigens had a FDR adjusted p-value<0.05).
Figure 4—figure supplement 2—source data 1. Source data for plot a.
Figure 4—figure supplement 2—source data 2. Source data for plot b.
Figure 4—figure supplement 2—source data 3. Source data for plot c.
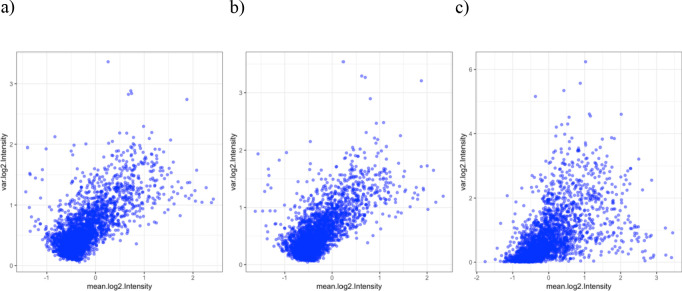
Figure 4—figure supplement 3. Variance and mean of the log2 signal intensities.

Figure 4—figure supplement 3.

Mean (x-axis) and variance (y-axis) of the normalized log2 signal intensities of each of the 2804 reactive antigens across (a) all samples at baseline (n = 46), (b) samples 2 weeks after immunization in the unprotected group (n = 33) and (c) samples 2 weeks after immunization in the protected group (n = 5).