
Figure 4. Structural equation model (SEM) showing the pathways through which climate change and intensive land use influence soil microarthropod biomass.
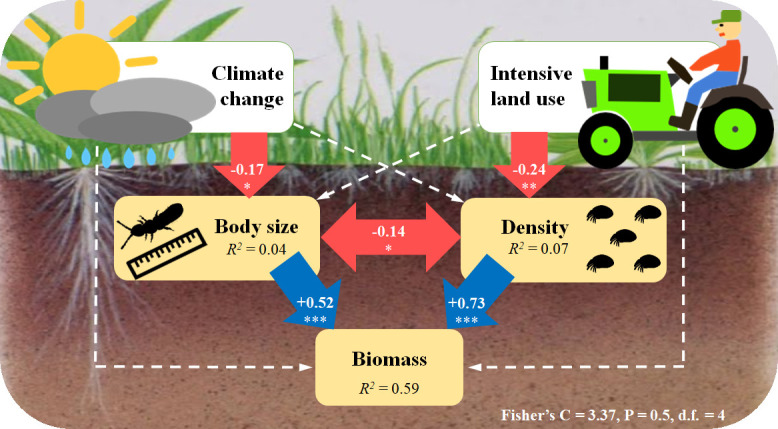
The final model (AIC = 33.37) is the best-fitting model, with Fisher’s C = 3.37; P = 0.5; d.f. = 4. Numbers in the arrows are standardized path coefficients. The blue (positive) and red (negative) one-way arrows indicate significant effects with * = P < 0.05, ** = P < 0.01, *** = P < 0.001. The dashed arrows indicate non-significant effects (P > 0.05) that are still remaining in this model. The double-headed red arrow indicates a significant correlation, with * = P < 0.05. The variance explained (R2) is shown in each panel.