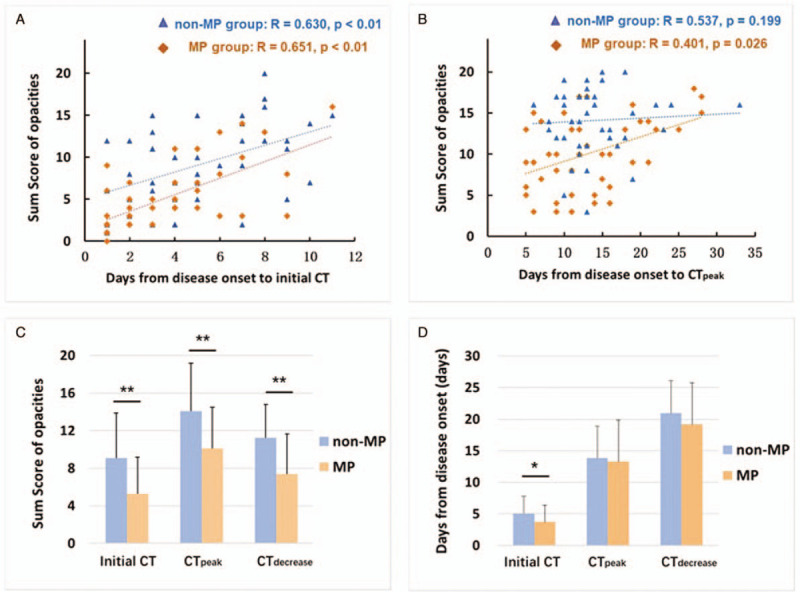
Figure 2.

A-B: Correlation between sum score and days from illness onset to initial CT; and days from illness onset to the most obvious pulmonary opacities were observed (CTpeak). (R denotes Pearson correlation coefficient with age and gender as covariates). C-D: Differences in mean values of sum score and disease duration to initial CT, CTpeak and the CT began to show decreased extent/density of the opacities (CTdecrease), between the MP and non-MP groups. Note that at the timepoint of CTdecrease, 41 patients in MP group and 40 patients in non-MP group were included. The bar height indicates the mean, and the line on top of the bar represents the standard deviation. Asterisk indicates a significant difference (∗P < .05, ∗∗P < .01).
