
Figure 6.
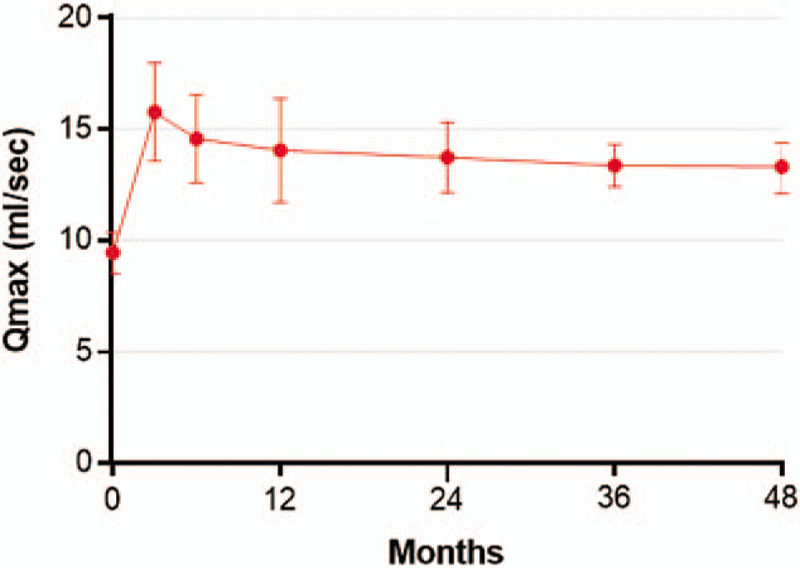
Temporal trends in Qmax (mL/s) following water vapor thermal therapy. Qmax values below 10 mL/s indicate abnormal urinary flow, values between 10 and 15 mL/s are borderline, and values greater than 15 mL/s indicate normal urinary flow. Plotted data are weighted mean and 95% confidence interval. Qmax = maximum flow rate.