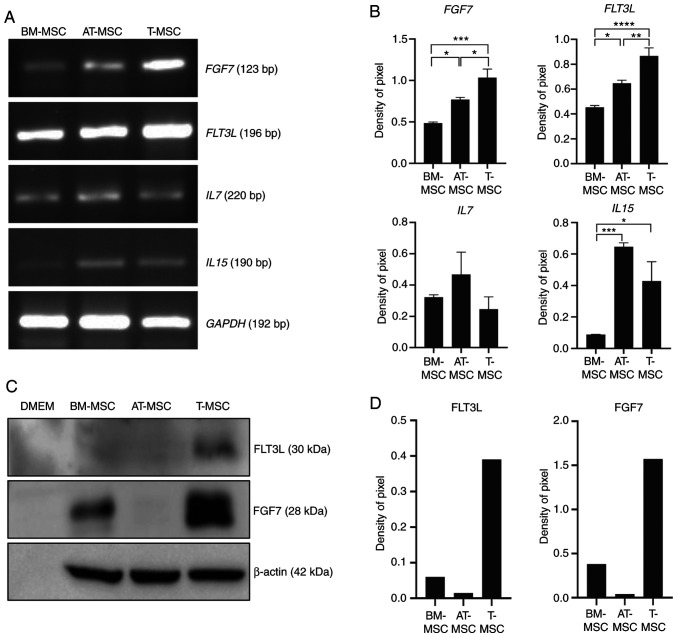
Figure 5.
Expression of factors related to thymus regeneration. (A) RNA was extracted from BM-MSCs, AT-MSCs, and T-MSCs at 80% confluence and analyzed by RT-PCR. (B) The pixel densities of the FGF7, FLT3L, IL7 and IL15 bands were divided by the pixel densities of the corresponding GAPDH bands. Data are presented as the means ± standard error (one-way ANOVA followed by Sidak's multiple comparisons test; *P<0.05, **P<0.01, ***P<0.001 and ****P<0.0001 as indicated). (C) Cell culture medium was collected and concentrated for immunoblotting to detect the expression of FLT3L and FGF7 in BM-MSCs, AT-MSCs, and T-MSCs. DMEM was loaded as the negative control. (D) The pixel densities of the FLT3L and FGF7 bands from representative blots were divided by the pixel densities of the corresponding β-actin bands. BM-MSCs, bone marrow-derived mesenchymal stromal cells; T-MSCs, tonsil-derived mesenchymal stromal cells; AT-MSCs, adipose tissue-derived MSCs.

