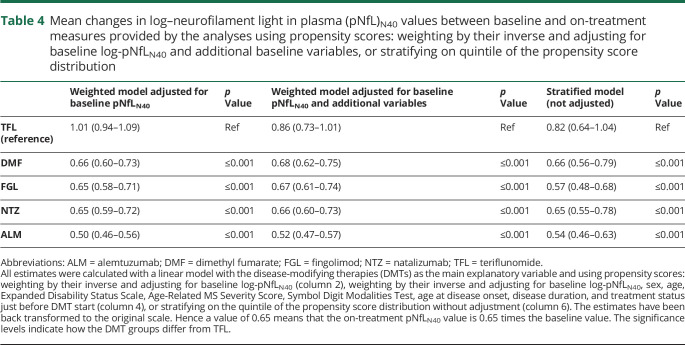
Table 4.
Mean changes in log–neurofilament light in plasma (pNfL)N40 values between baseline and on-treatment measures provided by the analyses using propensity scores: weighting by their inverse and adjusting for baseline log-pNfLN40 and additional baseline variables, or stratifying on quintile of the propensity score distribution

