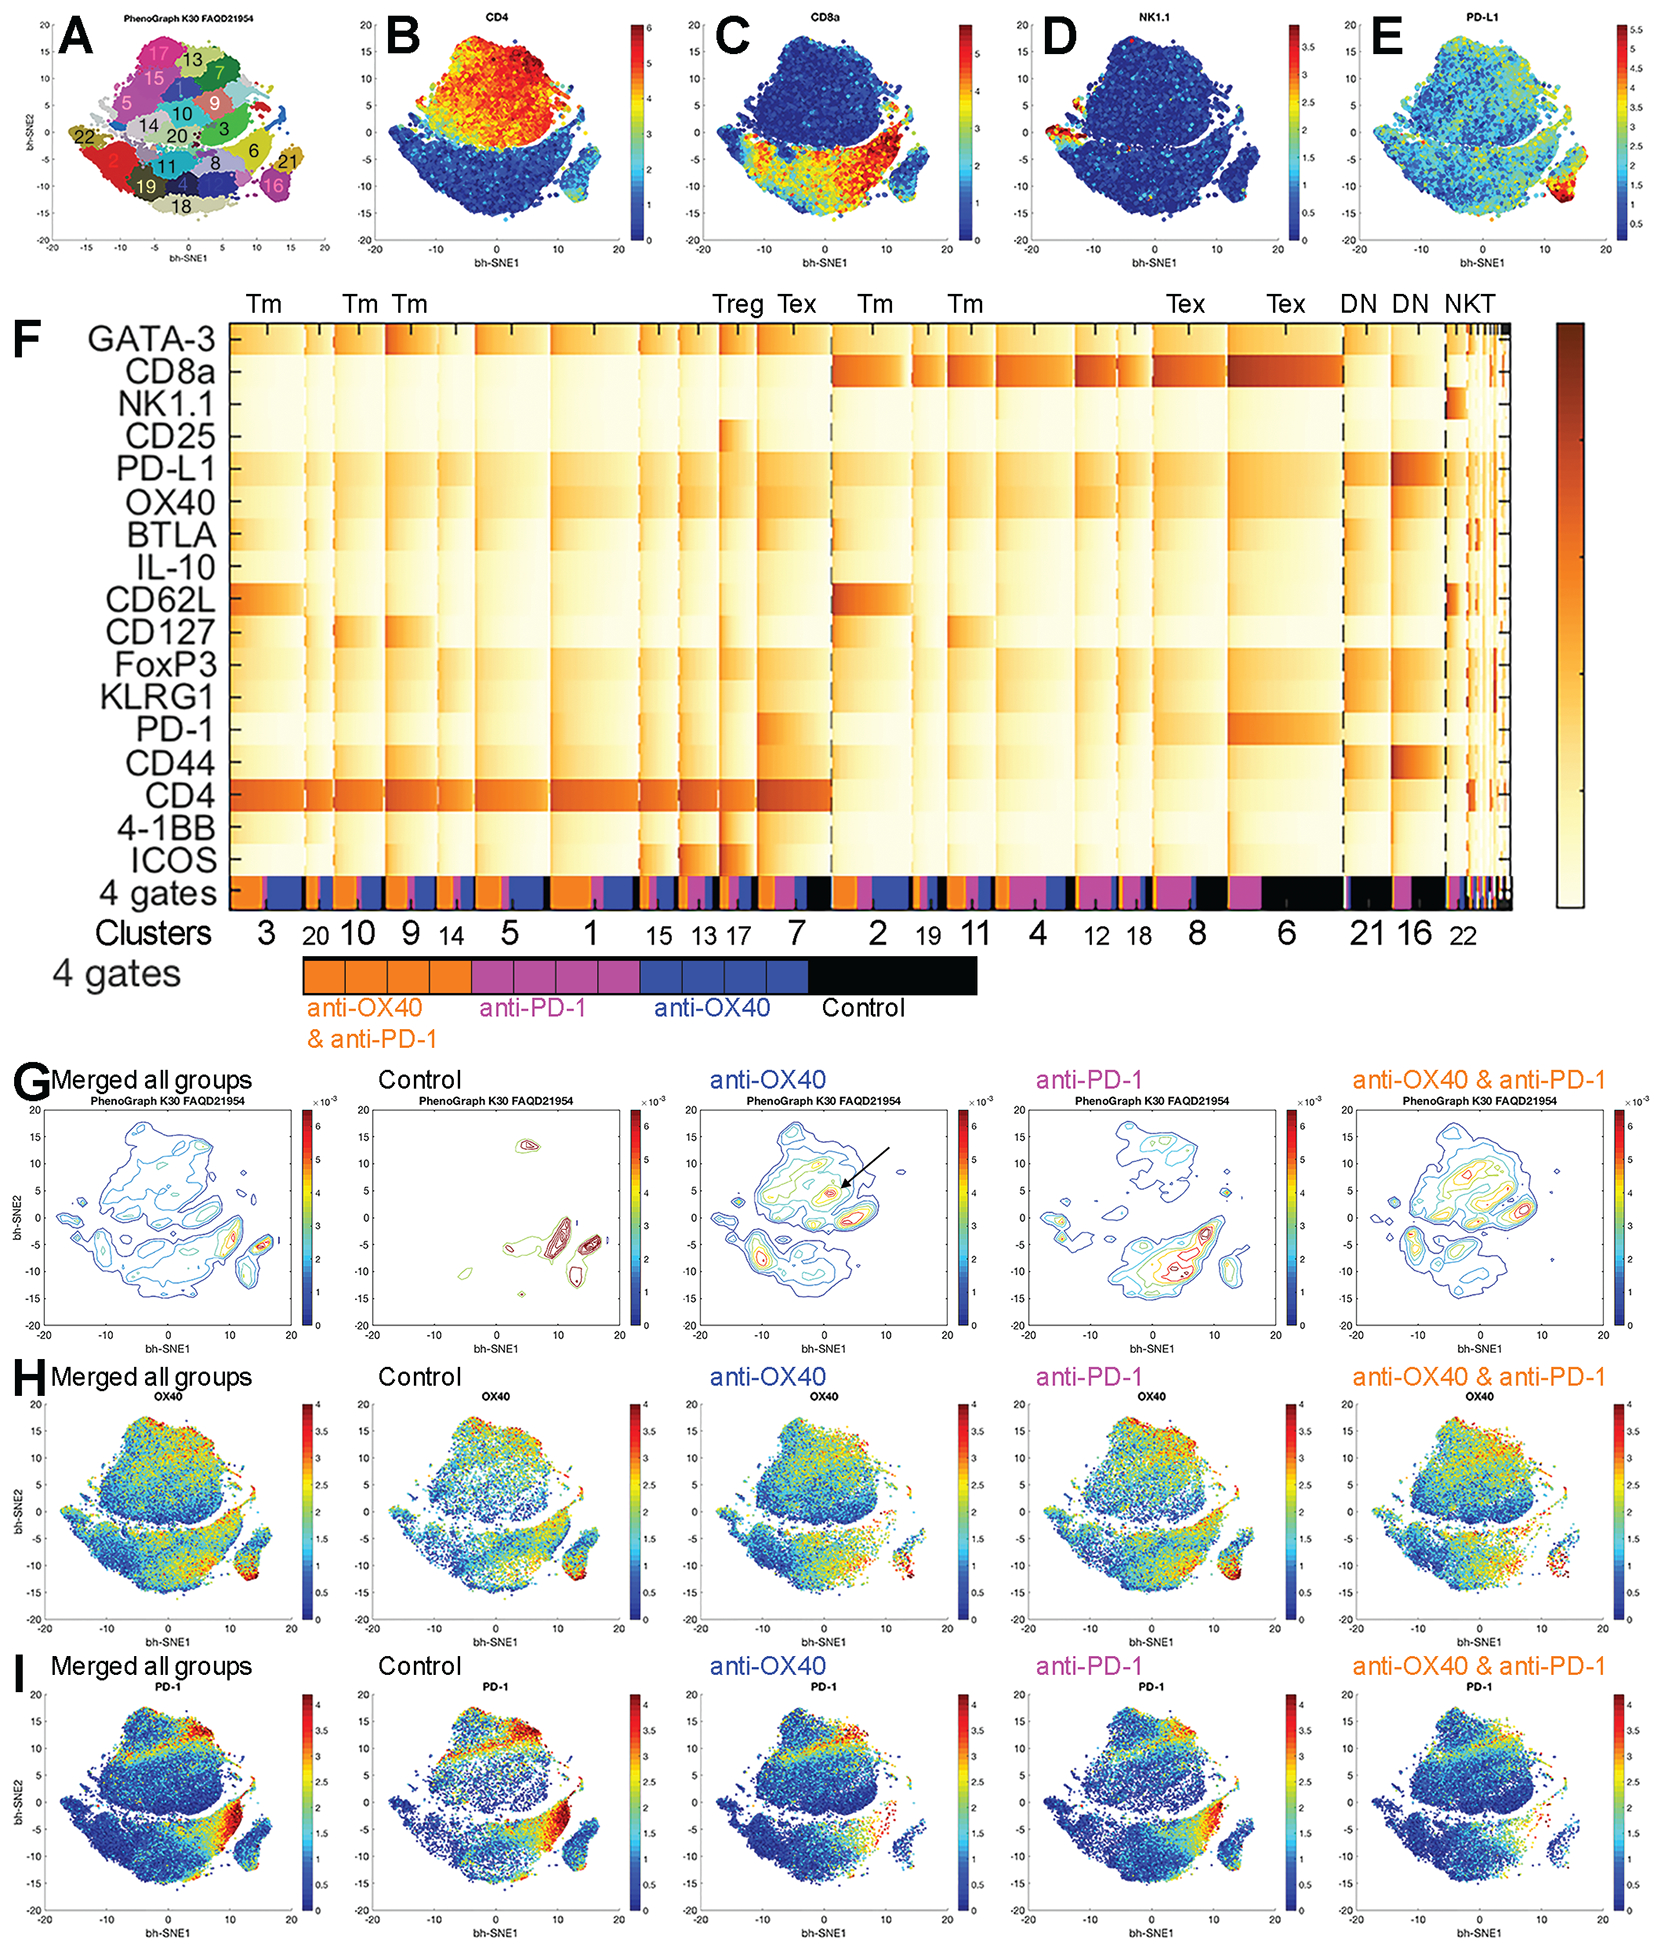
Figure 4. Identification of tumor-infiltrating T lymphocytes by anti-OX40 or anti–PD-1 by CyTOF analysis.

(A-E) tSNE plots of all T cells (A) with expression levels of CD4 (B), CD8 (C), NK1.1 (D), and PD-L1 (E) from all samples with number- and color-coded clusters.
(F) Heat map of normalized marker expression of T-cell clusters with the fractions of four gates. Gate source shows the pooled samples in each group at the bottom line of the heat map. Black: control, blue: anti-OX40 monotherapy, magenta: anti–PD-1 monotherapy, and orange: combination of anti–PD-1 and anti-OX40. Tm: memory T cells, Tex: PD-1 exhausted T cells, and DN: CD4 and CD8 double negative T cells.
(G-I) tSNE plots of all samples and control, anti-OX40, anti–PD-1, and anti–PD-1 and anti-OX40 groups.
(G) Density plots. Arrow in the anti-OX40 plot indicates GATA-3 CD4 cells.
(H) Plots of OX40 expression.
(I) Plots of PD-1 expression.
