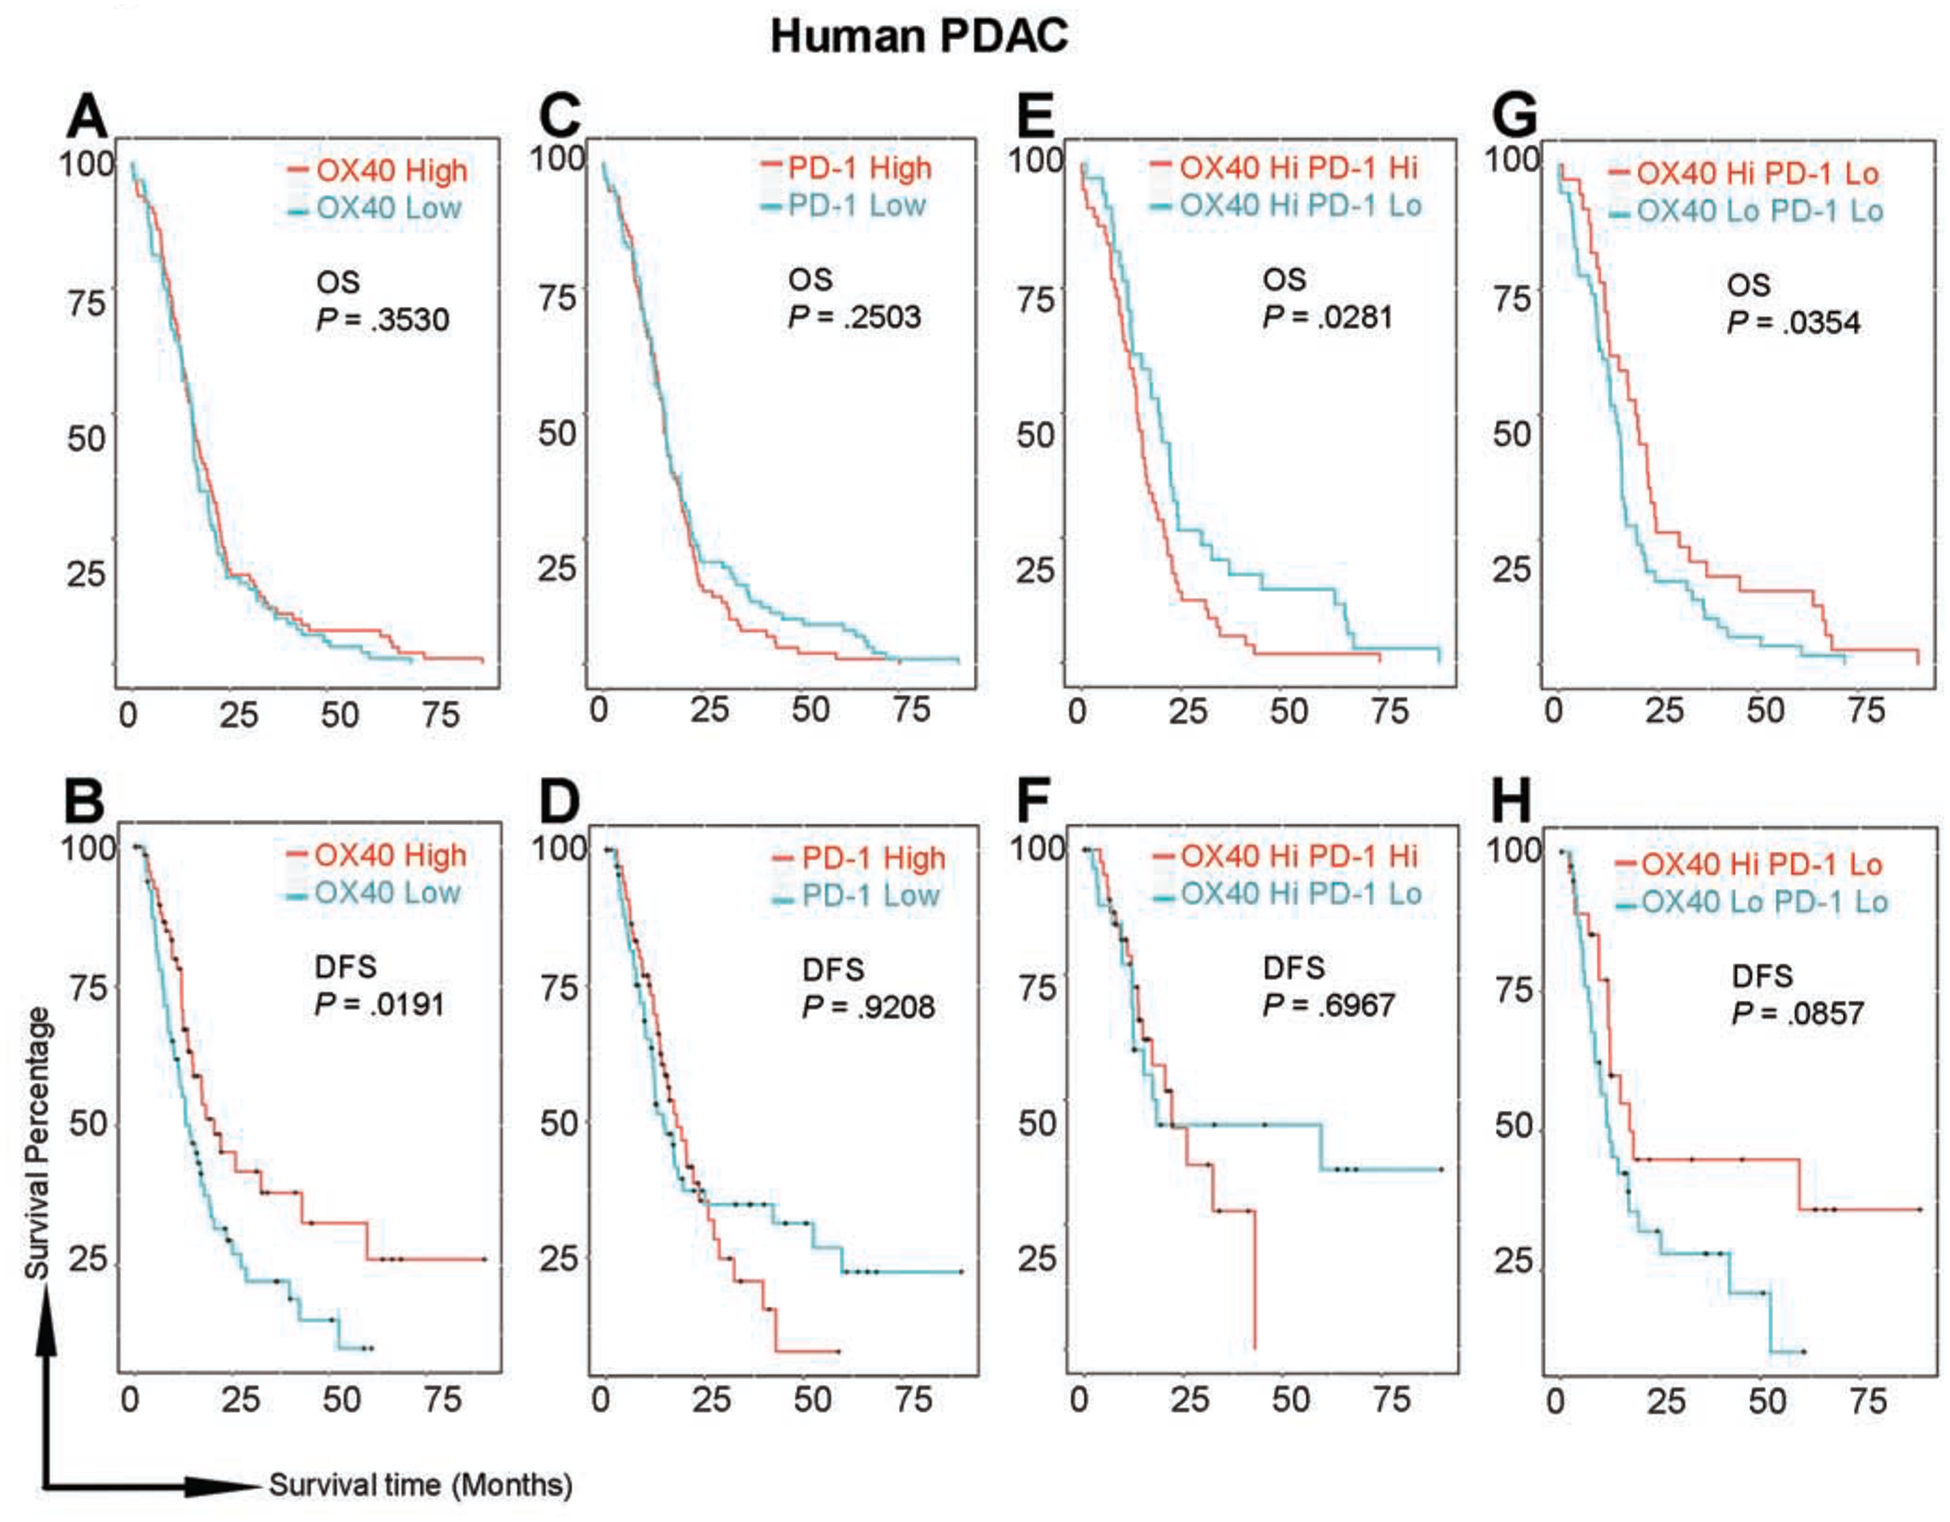
Figure 6. Patients’ prognosis is associated with the expression levels of OX40 and PD-1 in PDAC tumors in The Cancer Genome Atlas dataset.

(A, C, E, G) Overall survival (OS) did not significantly differ between patients grouped by OX40 (A) or PD-1 (C) levels only. Among patients with high OX40 expression (E), patients with low PD-1 lived significantly longer than did those with high PD-1. Among patients with low PD-1 expression (G), patients with high OX40 lived significantly longer than did those with low OX40.
(B, D, F, G) Disease-free survival (DFS) was significantly longer in patients with high OX40 than in those with low OX40 (B). There were no differences in DFS in other comparisons; however, tails on the survival curves were elevated in patients with low PD-1 compared with patients with high PD-1 in both the whole population (D) and in the subpopulation with high OX40 (F). Among patients with low PD-1 (H), the tail was elevated in patients with high OX40.
