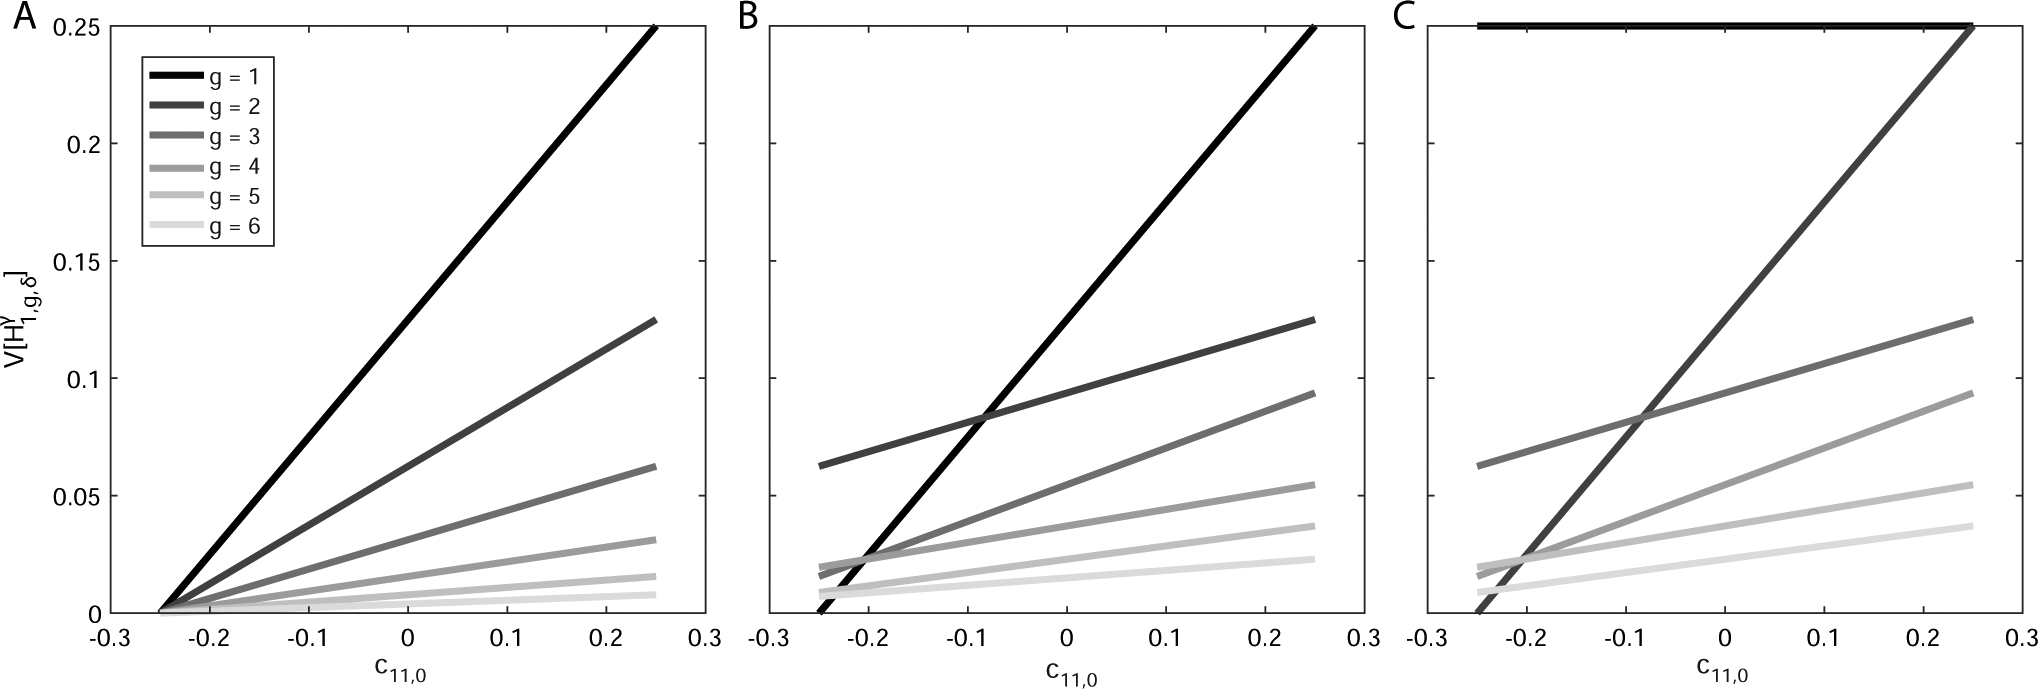
Figure 4:

Variance of ancestry under a single-admixture scenario as a function of the assortative mating parameter c11,0. (A) Autosomes, . (B) X chromosomes in a female, . (C) X chromosomes in a male, . In each panel, the variance is plotted over the range of c11,0, [−0.25, 0.25], for values of g between 1 and 6 (from darkest to lightest gray), with , using eqs. (41), (43), and (44).
