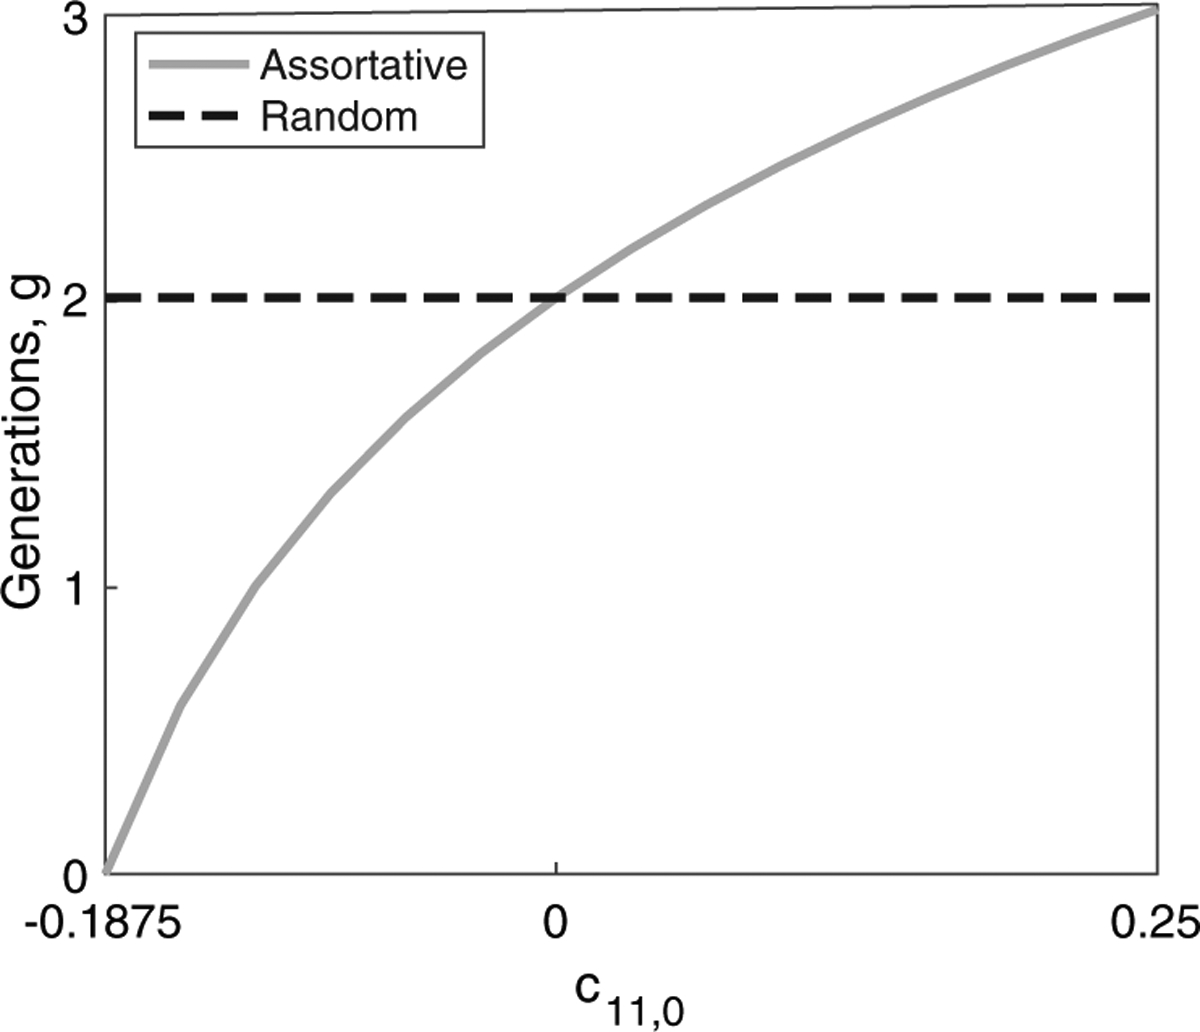
Figure 7:

Timing of admixture under assortative mating. The number of generations since admixture, g, for a single admixture event is plotted as a function of c11,0 using the variance in autosomal admixture, eq. (51), with V A = 0.0625 and . The plot traverses the range of possible c11,0 values for g ≥ 0. Recalling that the values of the cij,0 are bounded such that the probability of each given parental pairing takes its values in the interval [0, 1], and such that each probability is no greater than the probability of one of its constituent components, for c11,0 > 0, we have . In this case, c11,0 ≤ 0.25. For c11,0 < 0, we have . In this case, we have c11,0 ≥ −0.25. However, g cannot be negative; therefore, in this case, we truncate the domain at the value of c11,0 that produces g = 0. The value of g for a randomly mating population with the same contributions and variance is shown in the dashed line.
