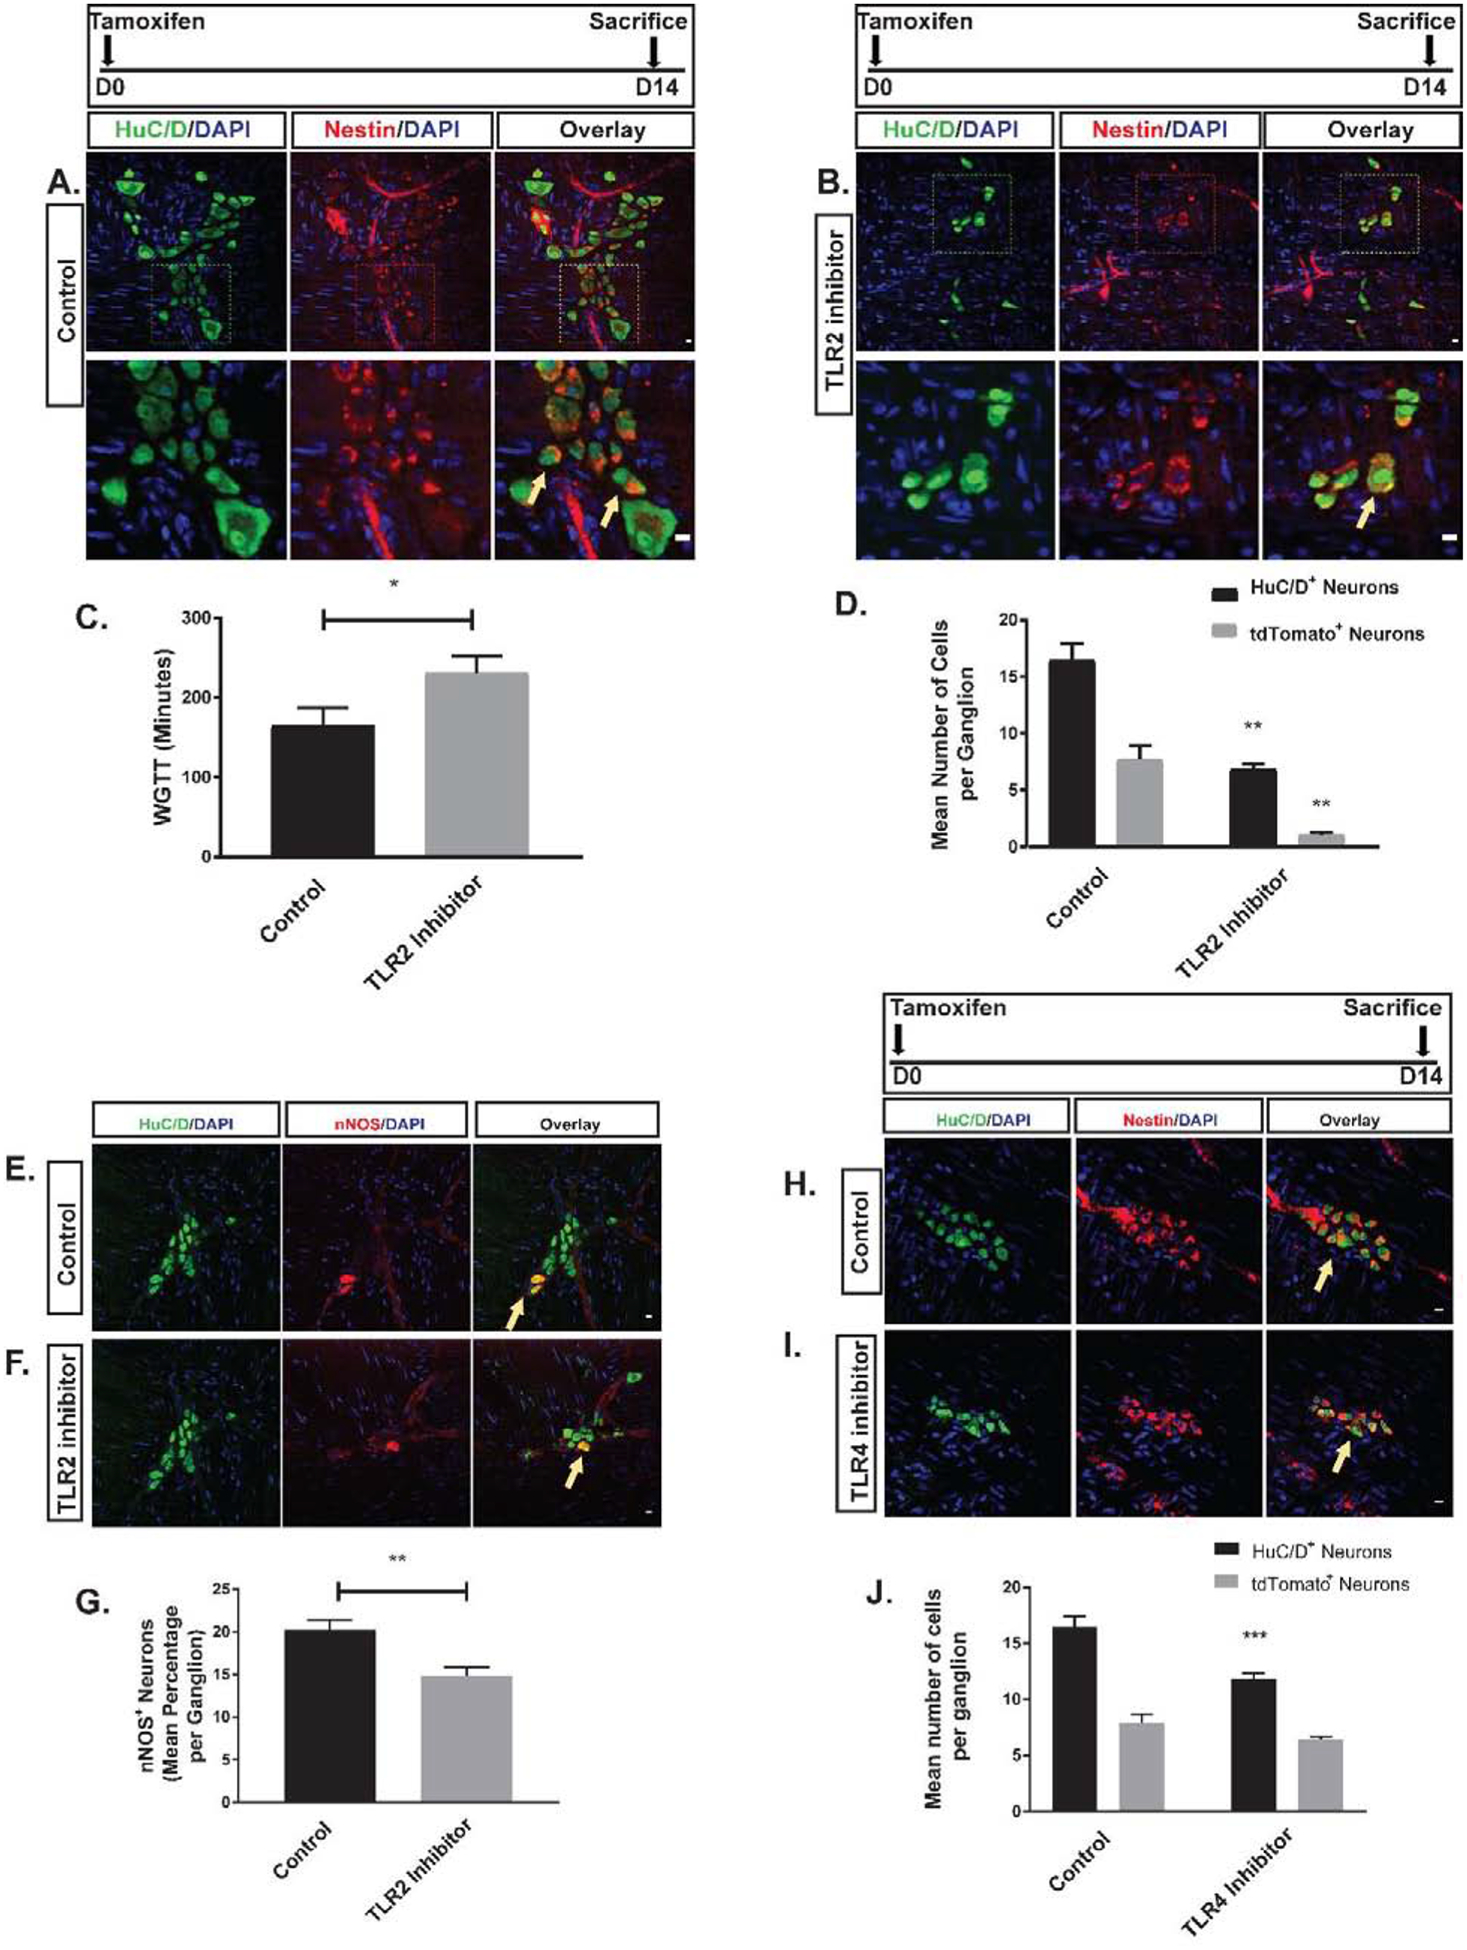
Figure 2. Effects of of TLR2 and TLR4 signaling on colonic neurogenesis.

A-B are representative photomicrographs of colonic myenteric ganglion of Nestin-creERT2:tdTomato mice after tamoxifen induction and immunostaining with the neuronal marker HuC/D (green) in two groups of vehicle and TLR2 inhibitor treated animals. E panels are representative photomicrographs of colonic myenteric ganglion after immunostaining with the neuronal marker HuC/D (green) and nNOS (red) in the same groups. (A) tdTomato+ neurons (arrow) within the myenteric plexus ganglion of control mice. Top panel and bottom panel overlays represent different magnifications showing that nestin derived neurons in the myenteric plexus (arrow) is reduced in mice treated with T2.5 (B). (C) Grouped results of WGTT under various conditions shows that WGTT is prolonged in the TLR2 inhibitor group (*p<0.05). (D) Grouped results of mean number of neurons and tdTomato–expressing neurons (newly formed neurons from ENPCs) under different conditions (**p<0.01). (E) Representative image of normal colonic myenteric ganglion containing nitrergic neurons (arrow). (F) T2.5 treatment reduced the total number of enteric neurons in a ganglion and reduced the proportion of nitrergic neurons within the ganglion. (G) Grouped results of mean percentage of nitrergic neurons under various conditions (**p<0.01). H-I are representative photomicrographs of colonic myenteric ganglion of Nestin-creERT2:tdTomato mice after tamoxifen induction and immunostaining with the neuronal marker HuC/D (green) in two groups of vehicle and TLR4 inhibitor treated animals. tdTomato+ neurons (arrow) within the myenteric plexus ganglion of control mice (H) and TLR4 inhibitor treated mice (I). (J) Grouped results of mean number of neurons and tdTomato–expressing neurons (newly formed neurons from ENPCs) under different conditions (***p<0.001). Scale bar is 10 μm.
