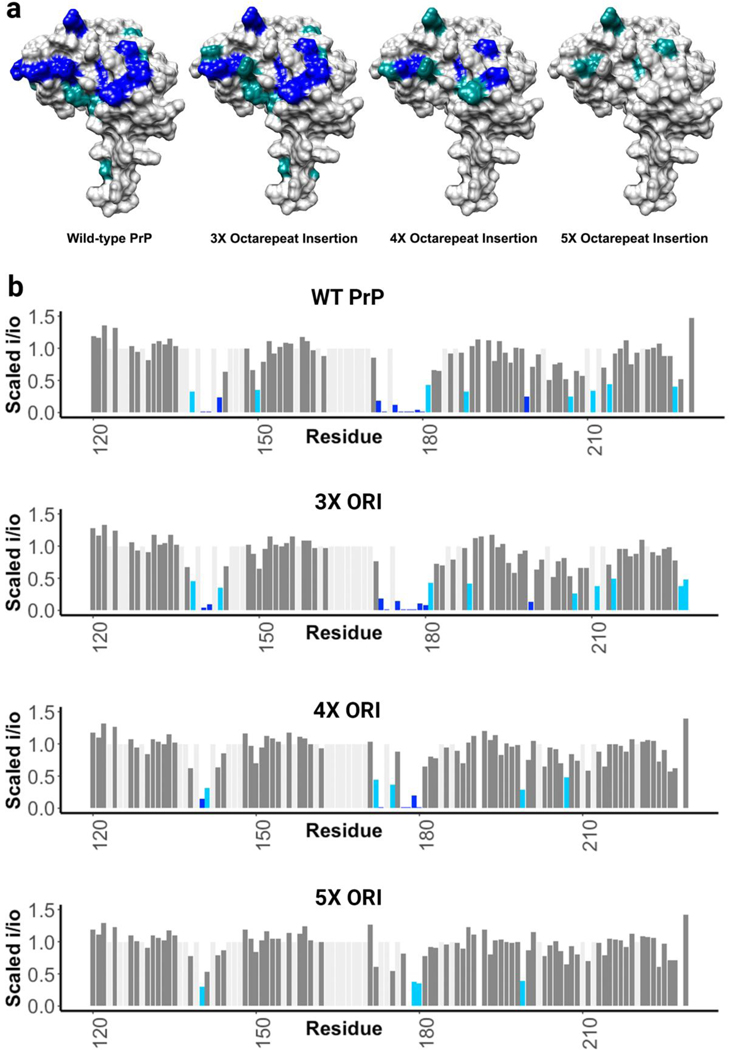
Figure 5.
a) Surface representations showing areas engaged in the cis interaction, as measured by the intensity reduction of NMR cross peaks, plotted on PDB: 1XYX. Five additional octarepeat regions results in a strong decrease in the cis interaction. b) Bar plots showing the magnitude of the peak intensity reduction derived from the paramagnetic relaxation effect (PRE) on specific residues of the protein’s C-terminal domain, with 1 equivalent of CuCl2 at pH 6.0 in 10 mM MES buffer for all protein samples.

