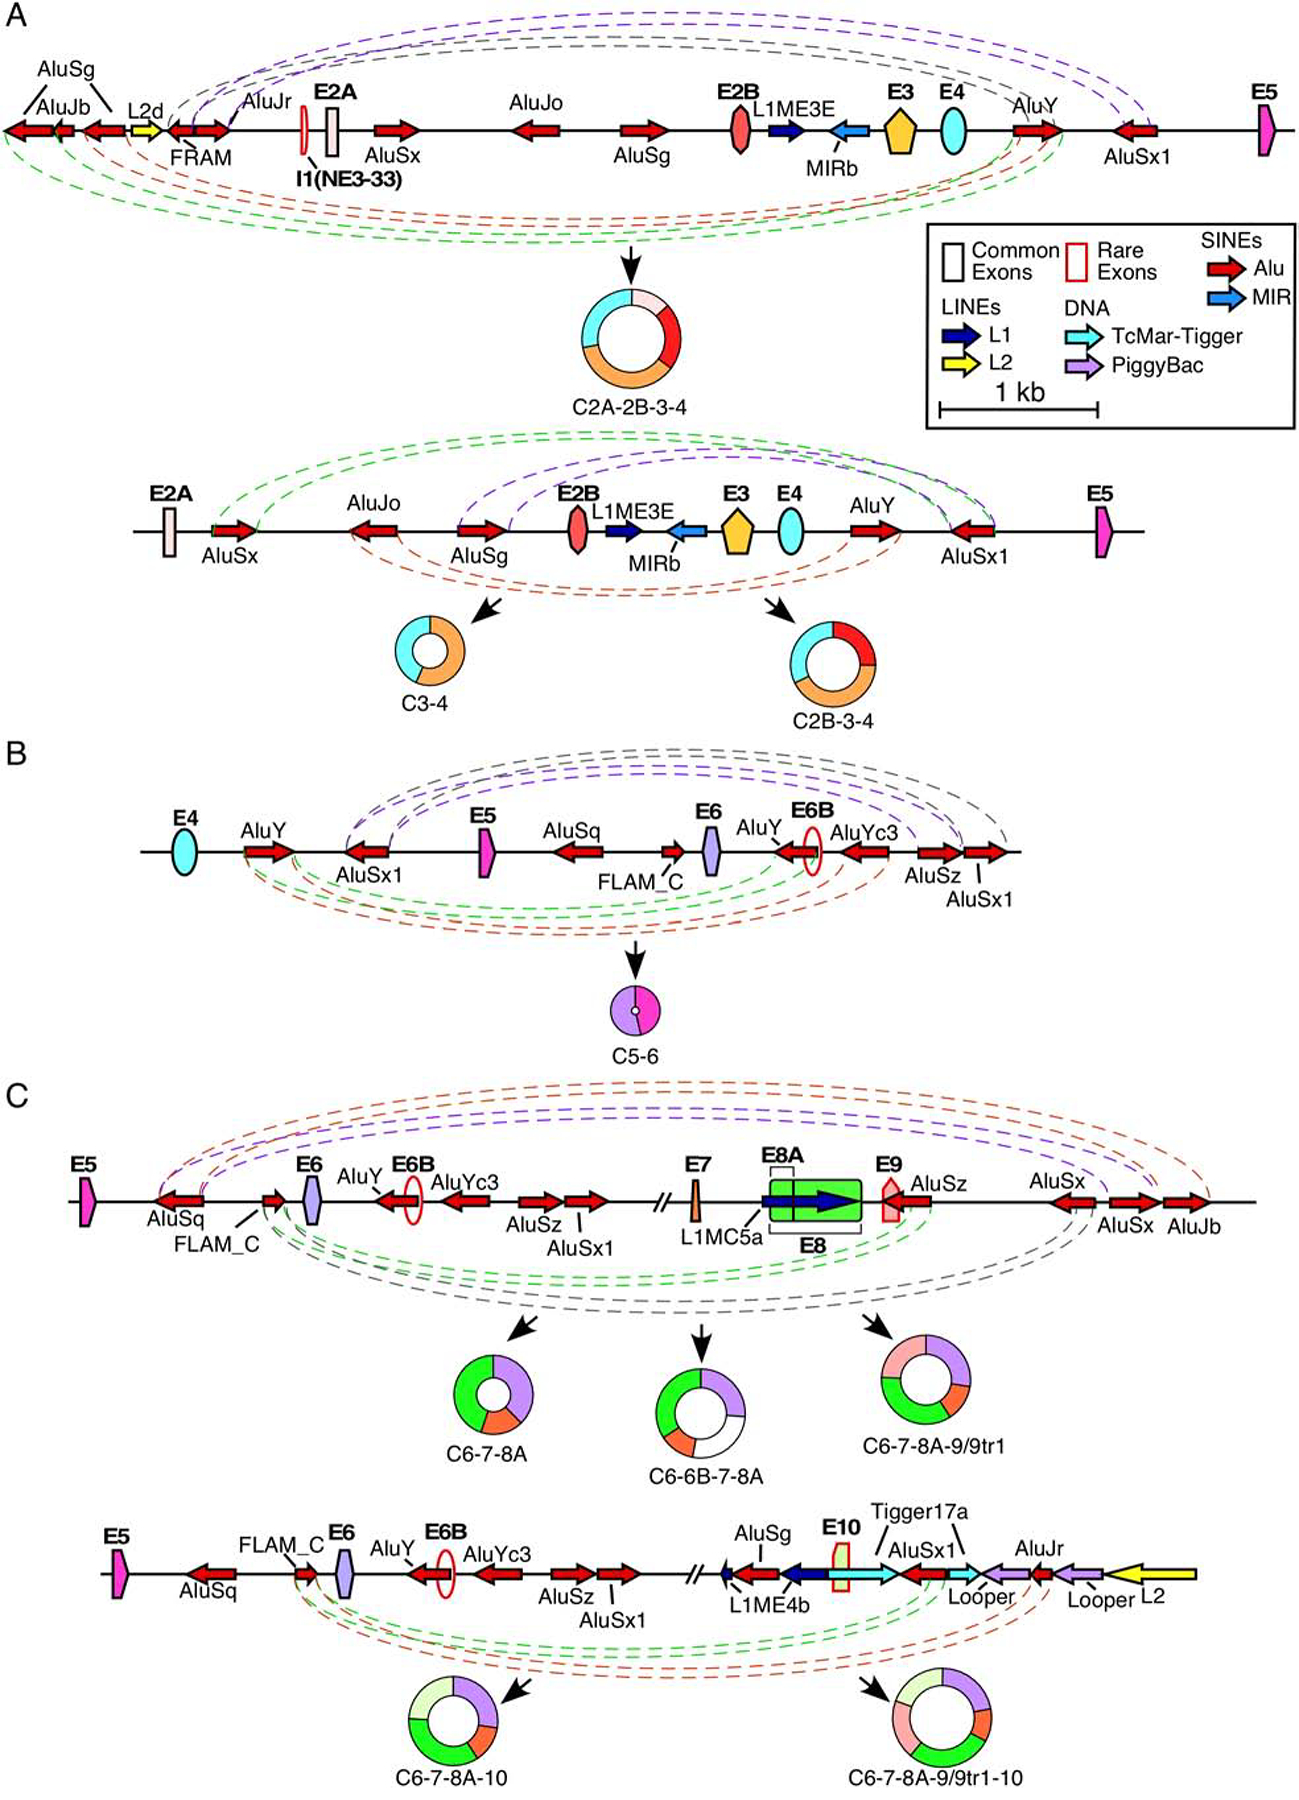
Figure 3. Potential Alu:Alu pairing leading to exon circularization.

(A) Alu-mediated backsplicing of major type 1 circRNAs. Top panel shows the genomic overview of the region from ~2kb upstream of exon 2A to exon 5 and production of C2A-2B-3–4, bottom panel shows the region from exon 2A to exon 5 and production of C2B-3–4 and C3–4. Exons are shown as colored shapes and labeled in bold. Introns are represented by black lines. Repeat elements are represented by colored arrows, the direction of each arrow indicating the orientation of the repeat. Dashed colored lines denote potential pairings between complementary Alu elements. Coloring is arbitrary and is meant to aid in distinguishing between pairings. The circRNA(s) predicted to result from Alu:Alu base pairing is indicated below. Scale and color coding of exons and repeat sequences is given in the boxed region. (B) Alu-mediated backsplicing of C5–6, the major type 2 circRNA. The genomic overview of the region from exon 4 to ~2 kb downstream of exon 6 is given. Coloring and labeling are the same as in (A). (C) Alu-mediated backsplicing of major type 3 circRNAs. The top panel shows the genomic overview of the region from exon 5 to ~2 kb downstream of exon 9 and production of C6–7–8A, C6–6B–7–8A, and C6–7–8A–9/9tr1. The bottom panel shows the genomic overview of the region from exon 5 to ~2kb downstream of exon 10 and production of C6–7–8A–10 and C6–7–8A–9/9tr1–10. Coloring and labeling are the same as in (A).
