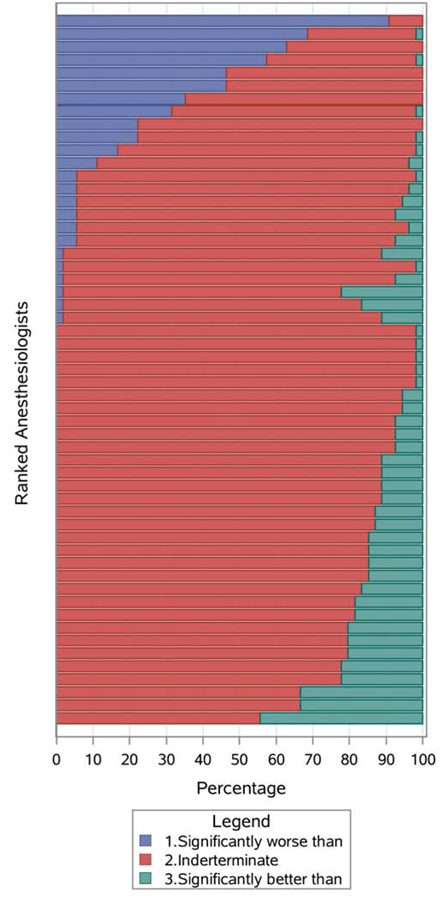
Fig. B.
Visualization of the pairwise comparison distribution that derived from the multivariable ordered probit regression model (10,528 surveys, 55 attending anesthesiologists). The percentage panel reveals the proportion of other individual anesthesiologists for whom each individual was statistically significantly worse than (blue), indeterminate (red) and better than (green).

