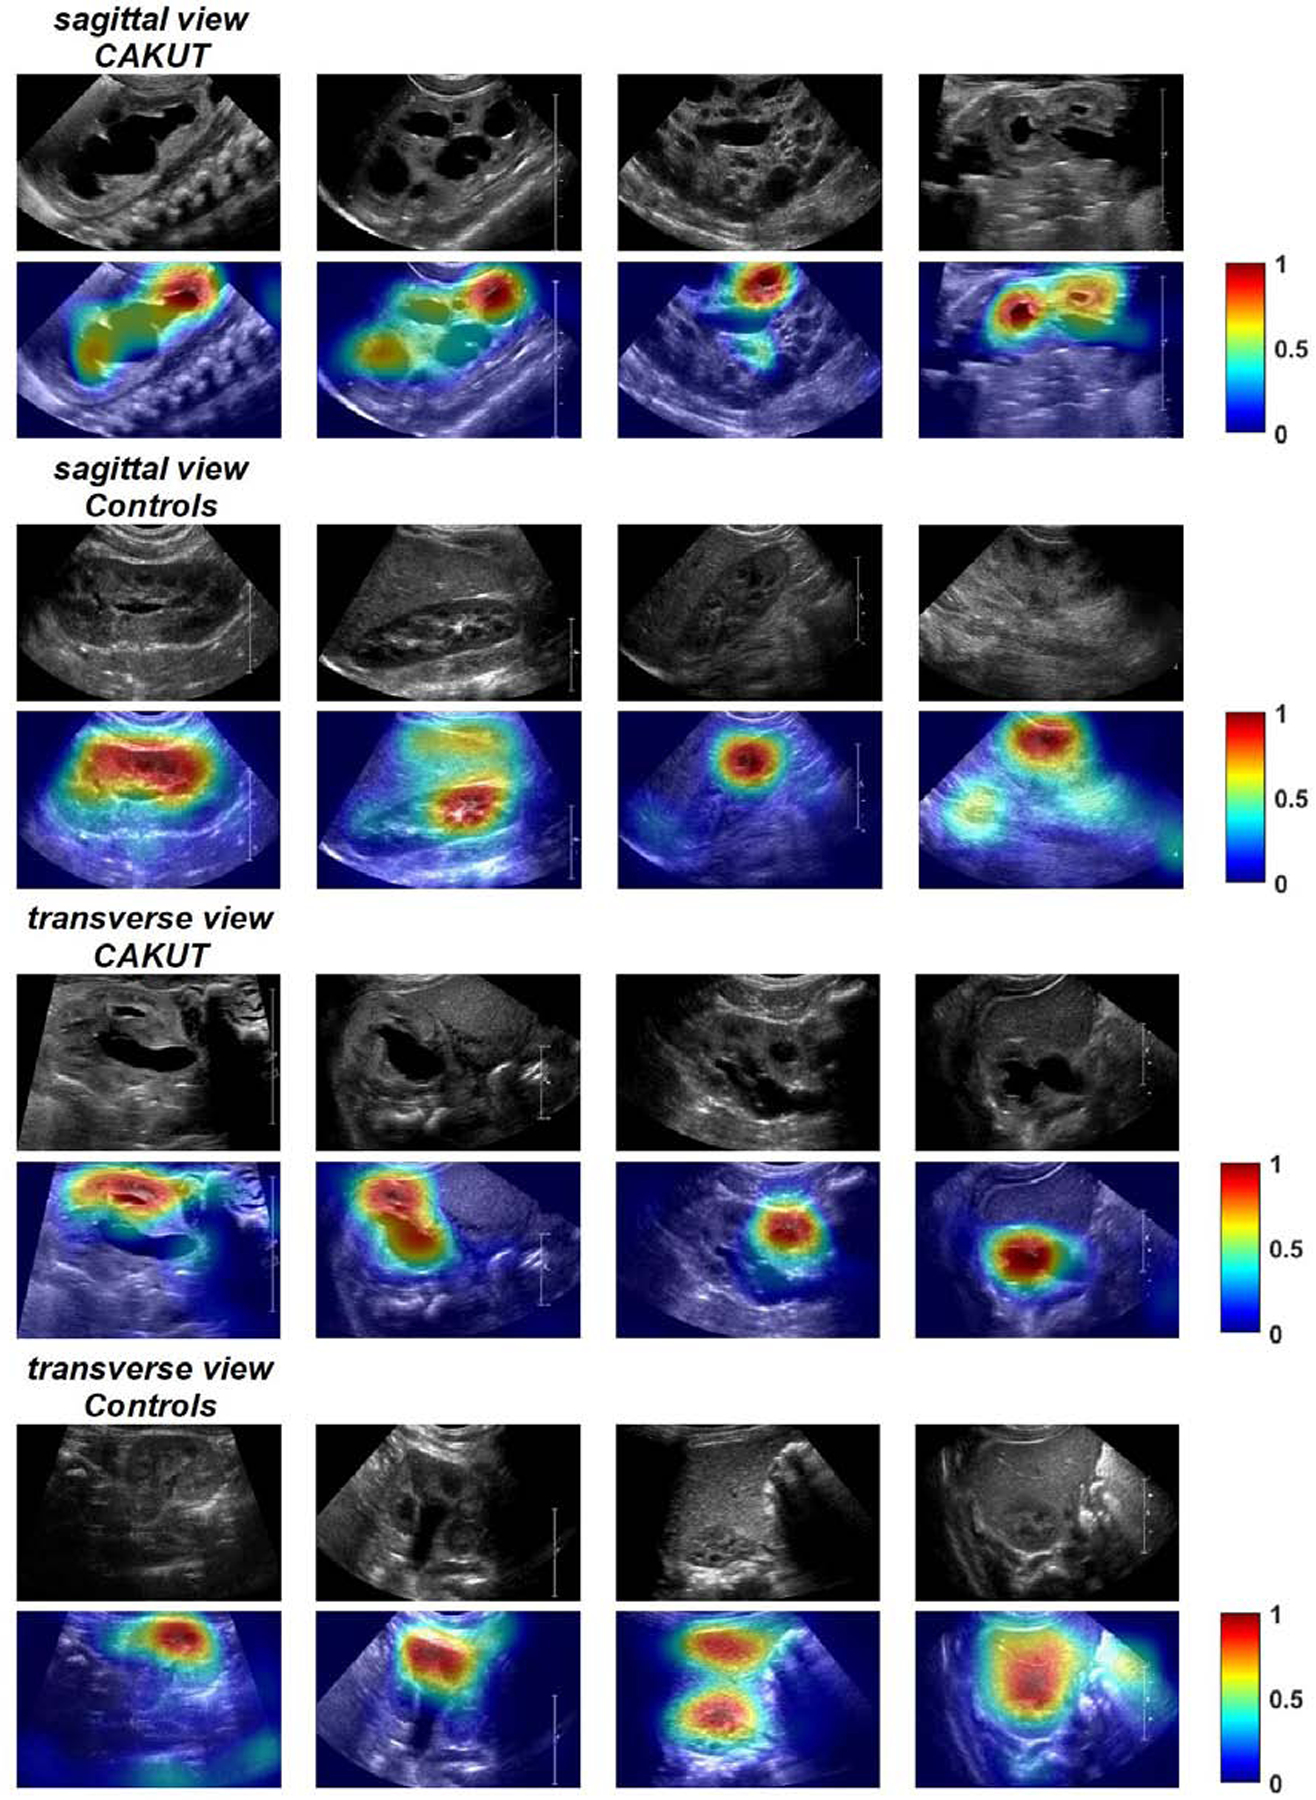
Figure 2.

Class activation mapping results of randomly selected CAKUT and control kidney images obtained by the SIL model trained on images in sagittal view and transverse view. Kidney regions in warm color contributed more to the classification than those in cold color. The color bar indicates relative activation.
