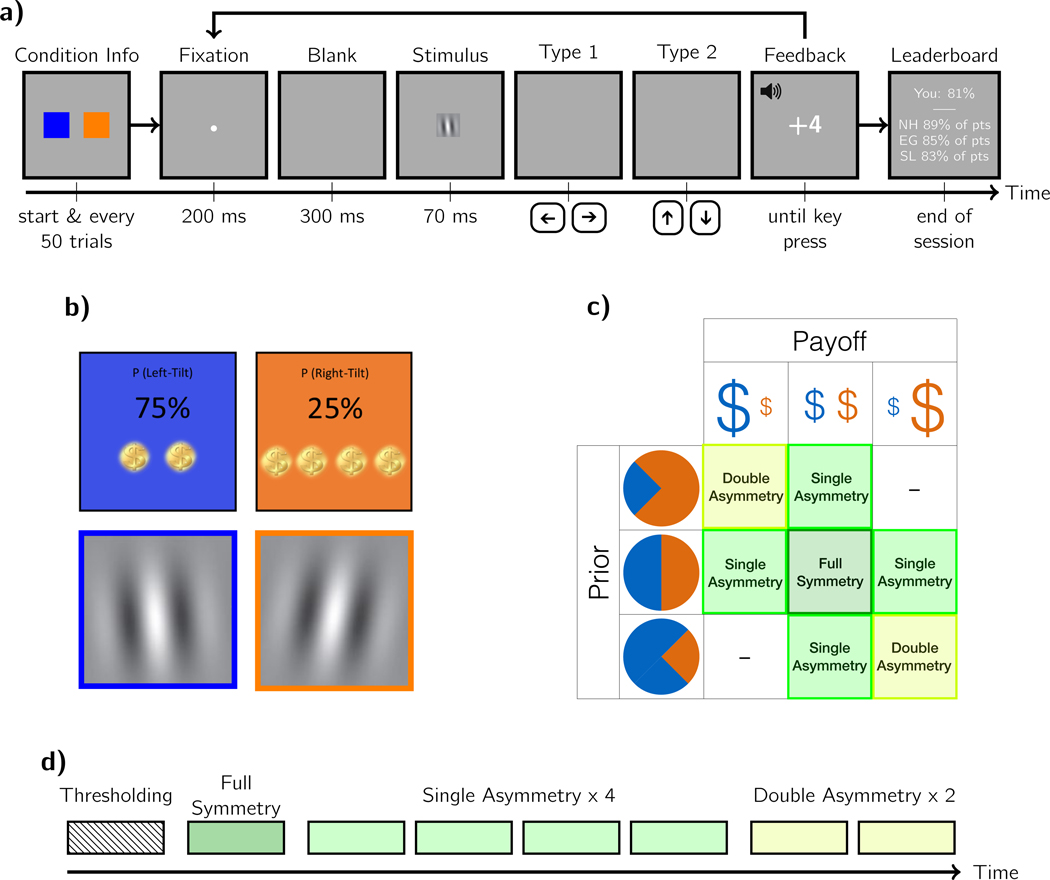
Figure 2:

Experimental methods. a) Trial sequence including an outline of the initial condition information screen (see part (b) for details) and final (mock) leaderboard screen. Participants were shown either a right- or left-tilted Gabor and made subsequent Type 1 and Type 2 decisions before being awarded points and given auditory feedback based on the Type 1 discrimination judgment. b) Sample condition-information displays from a double-asymmetry condition. Below: Example Gabor stimuli, color-coded blue for left- and orange for right-tilted. The exact stimulus orientations depended on the the participant’s sensitivity. c) Condition matrix. Pie charts show the probability of stimulus alternatives (25, 50, or 75%) and dollar symbols represent the payoffs for each alternative (2, 3, or 4 pts). Squares are colored and labeled by the type of symmetry. d) Timeline of the eight sessions. The order of conditions was randomized within the single- and within the double-asymmetry conditions.
