
Figure 1.
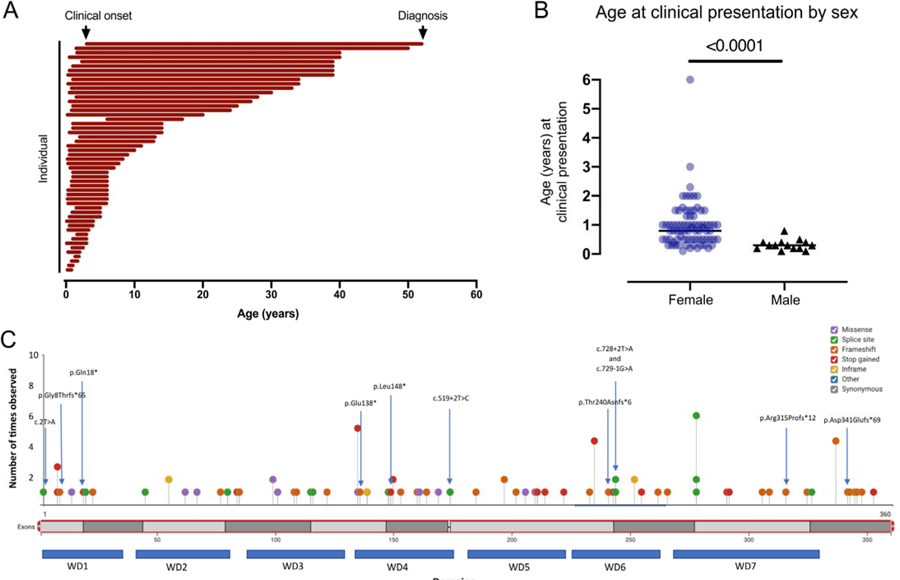
Presentation and diagnosis of WDR45. (A) Each line represents the interval in years between clinical onset and diagnosis (n=54, including n=6 males). (B) The age at clinical presentation was compared by sex (line= median value; n=77 females, n=14 males; Mann Whitney test, 2-tailed p value <0.001). (C) Distribution of variants found in the cohort of individuals with WDR45-related disease.