
Figure 3.
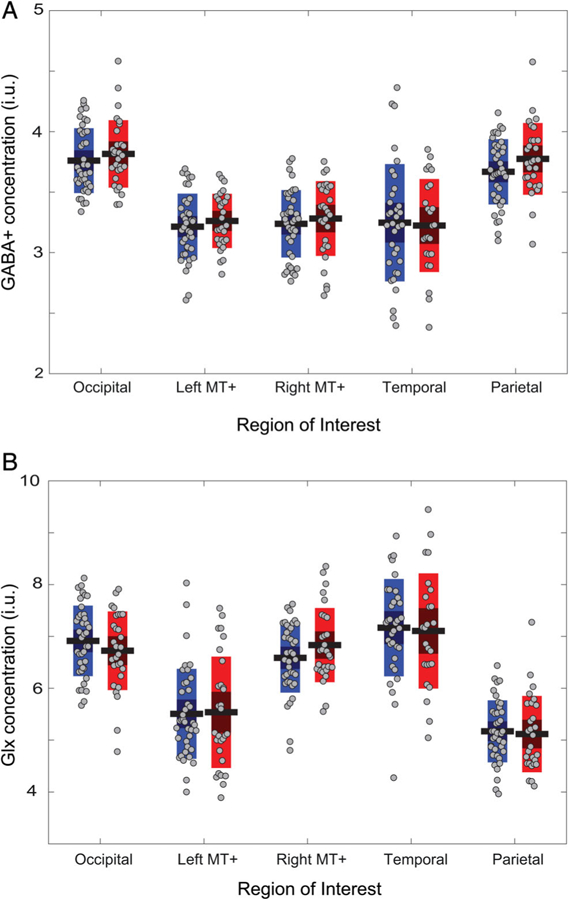
No group differences in GABA+ concentration (A) or in Glx concentration (B). For each region of interest, the left bars (blue) represent the NT group, the right bars (red) represent the ASD group. Horizontal black lines denote group mean, bars denote 95% confidence intervals, and the central dark area of the bar denotes 1 SD around the mean. Gray symbols represent individual participants. i.u., institutional units.