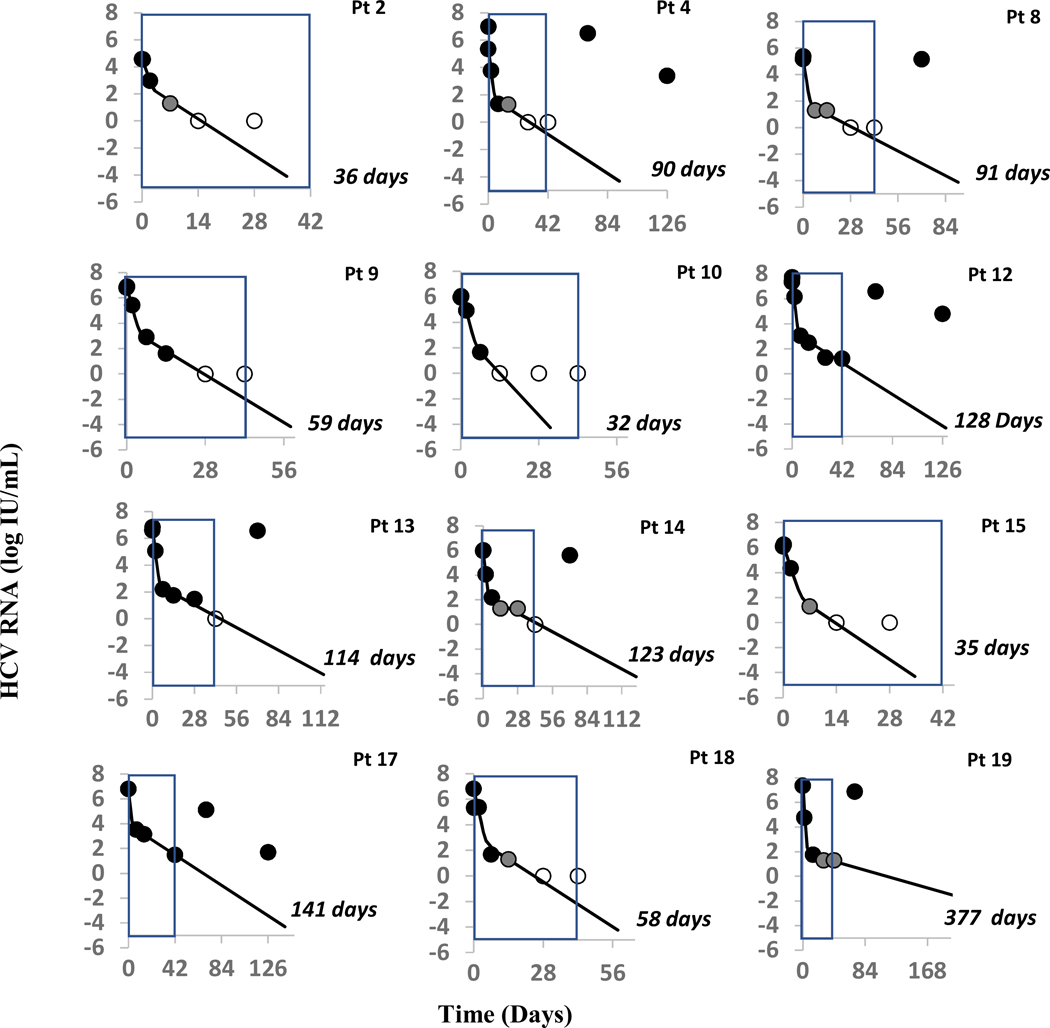
Figure 1:
Viral Kinetics Modeling Results
Fig. 1: Pt 2* achieved SVR. Observed viral kinetics and model predicted curves in eleven subjects, who did not achieve SVR. Black circles: quantifiable HCV; grey circles: detected, below LLoQ; open circles: below lower limit of detection; solid lines: biphasic model best fit curve, ending when cure threshold is reached; blue box represents the six weeks of therapy received by each patient. Model curves end when predicted time to cure is reached. Orange transparent box indicates the cure boundary predicted by the modeling. During modeling, the initial virus clearance, c, value was set to 2.0 d−1 for all 11 patients. Patient 19 only shows the curve till 300 days as model predicted time to cure that is too long to be graphed.

