Figure 1:

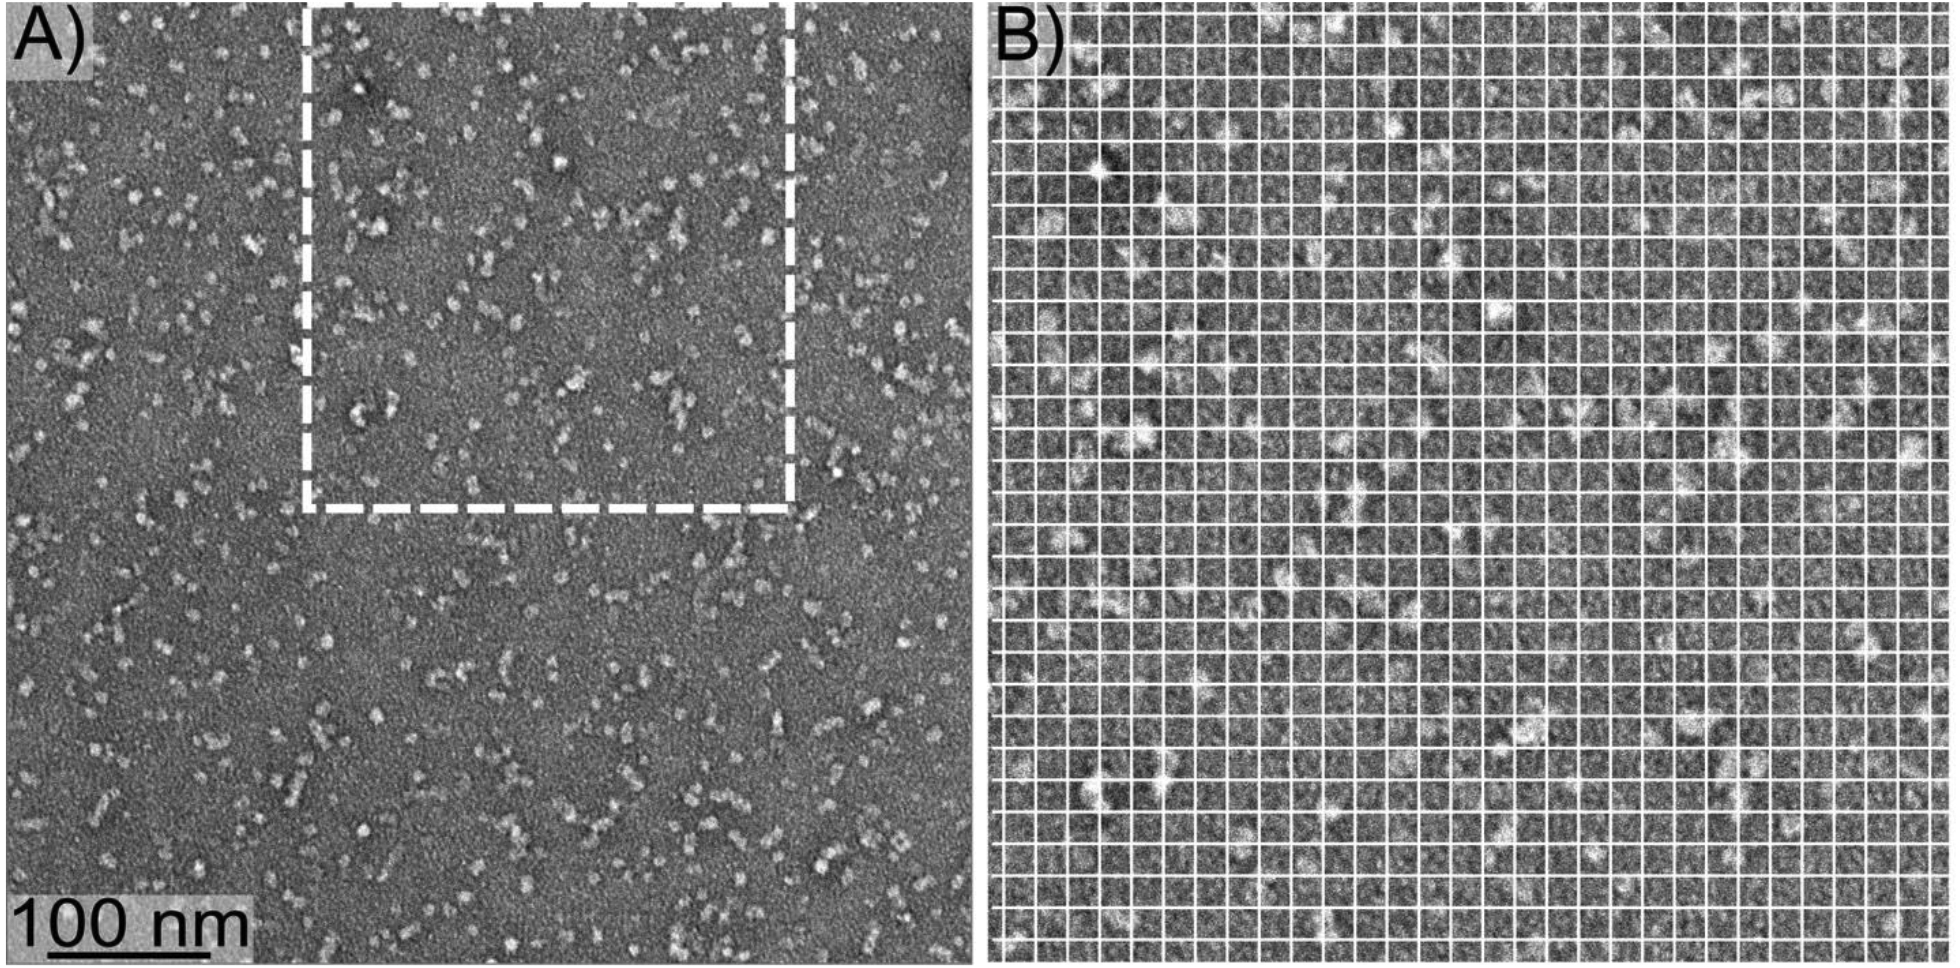
A) A negative-stain TEM image of 150 kDa oligomers. B) The region from Panel A indicated by the dashed square, enlarged to more clearly show oligomer size. The white gridlines are separated by 10 nm.

A) A negative-stain TEM image of 150 kDa oligomers. B) The region from Panel A indicated by the dashed square, enlarged to more clearly show oligomer size. The white gridlines are separated by 10 nm.