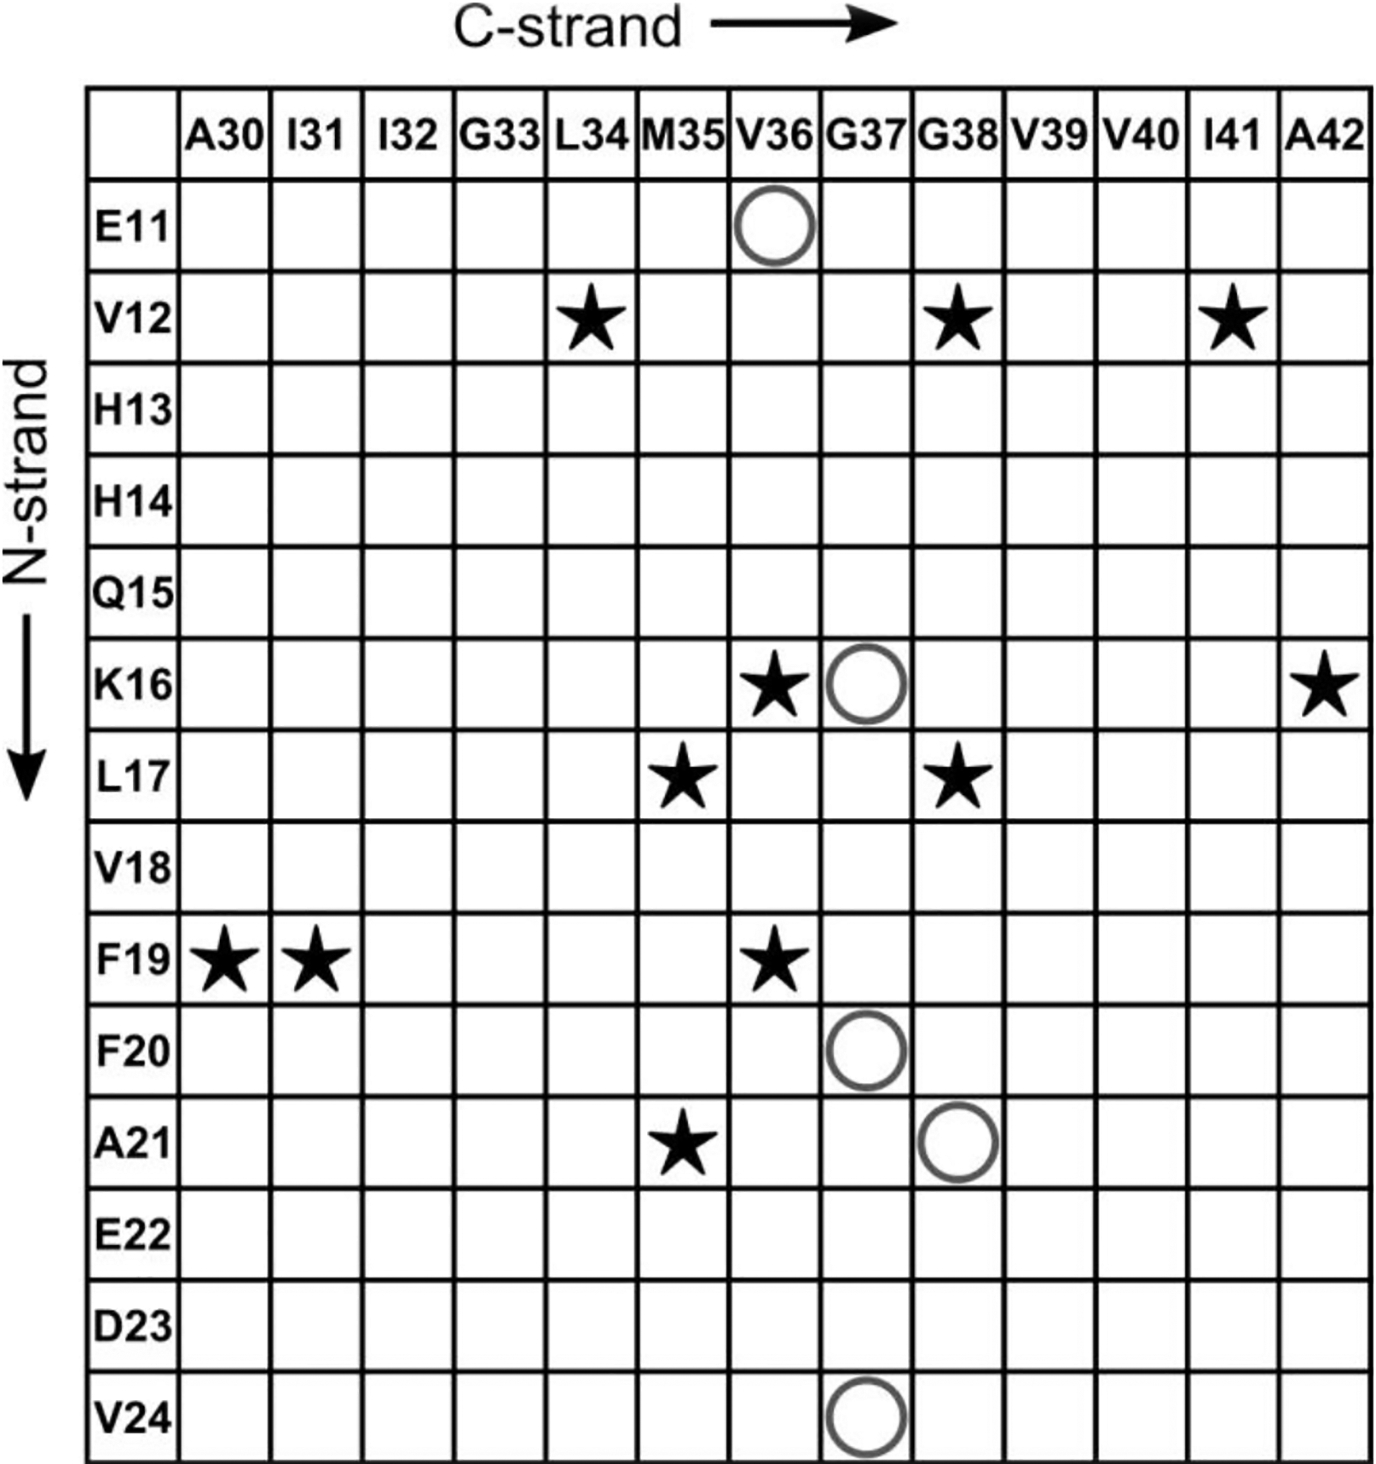
Figure 10.

A contact chart that summarizes the experimentally detected and non-detected interactions between the residues in N-strand and that in C-strand. The star symbols (★) indicate pairs of residues whose cross-peaks were observed in 500 ms 2D-DARR spectra, while the “O” symbols represent the pairs from all 13C-labeled peptides that did not show cross-peaks in spectra.
