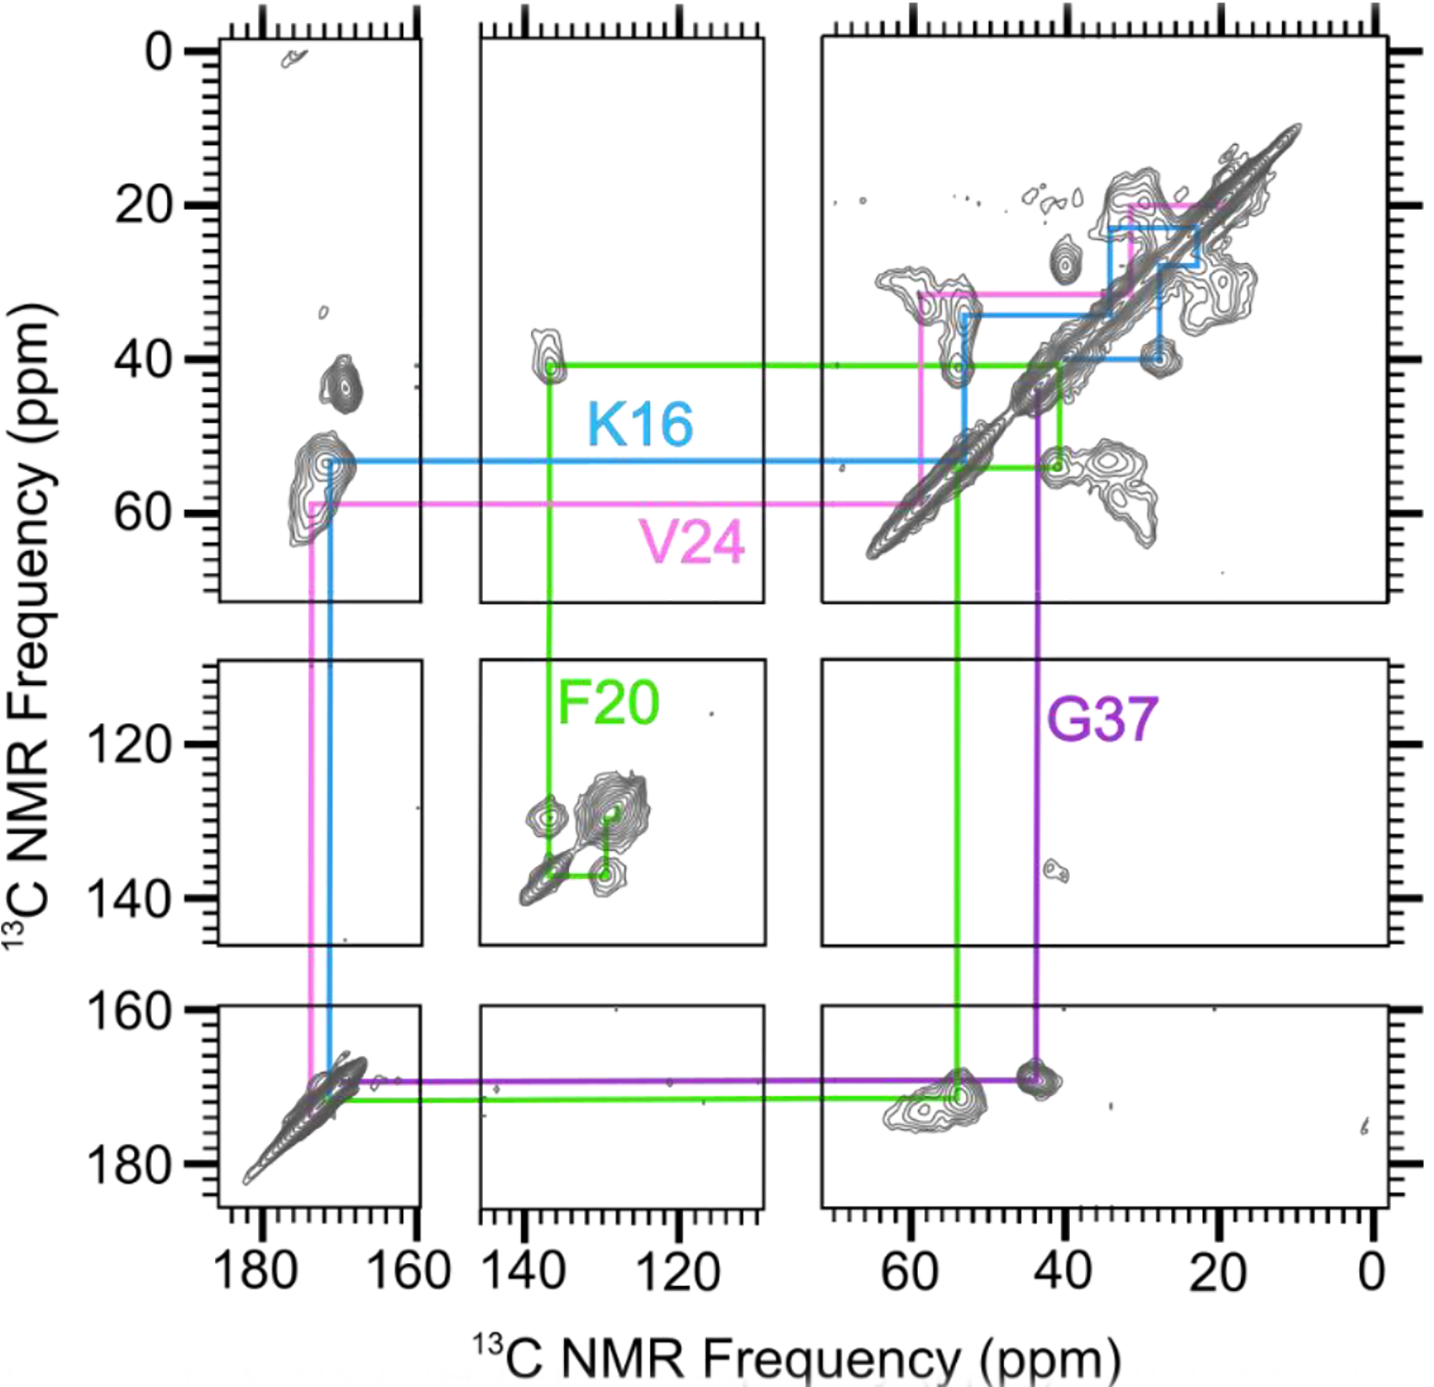
Figure 2:

A 2D-fpRFDR spectrum of 150 kDa Aβ(1–42) oligomer sample that was uniformly labeled with 13C at K16, F20, V24, and G37 (Sample 1 in Table 1). Colored lines indicate spectral assignments based on crosspeaks between directly bonded 13C atoms.
