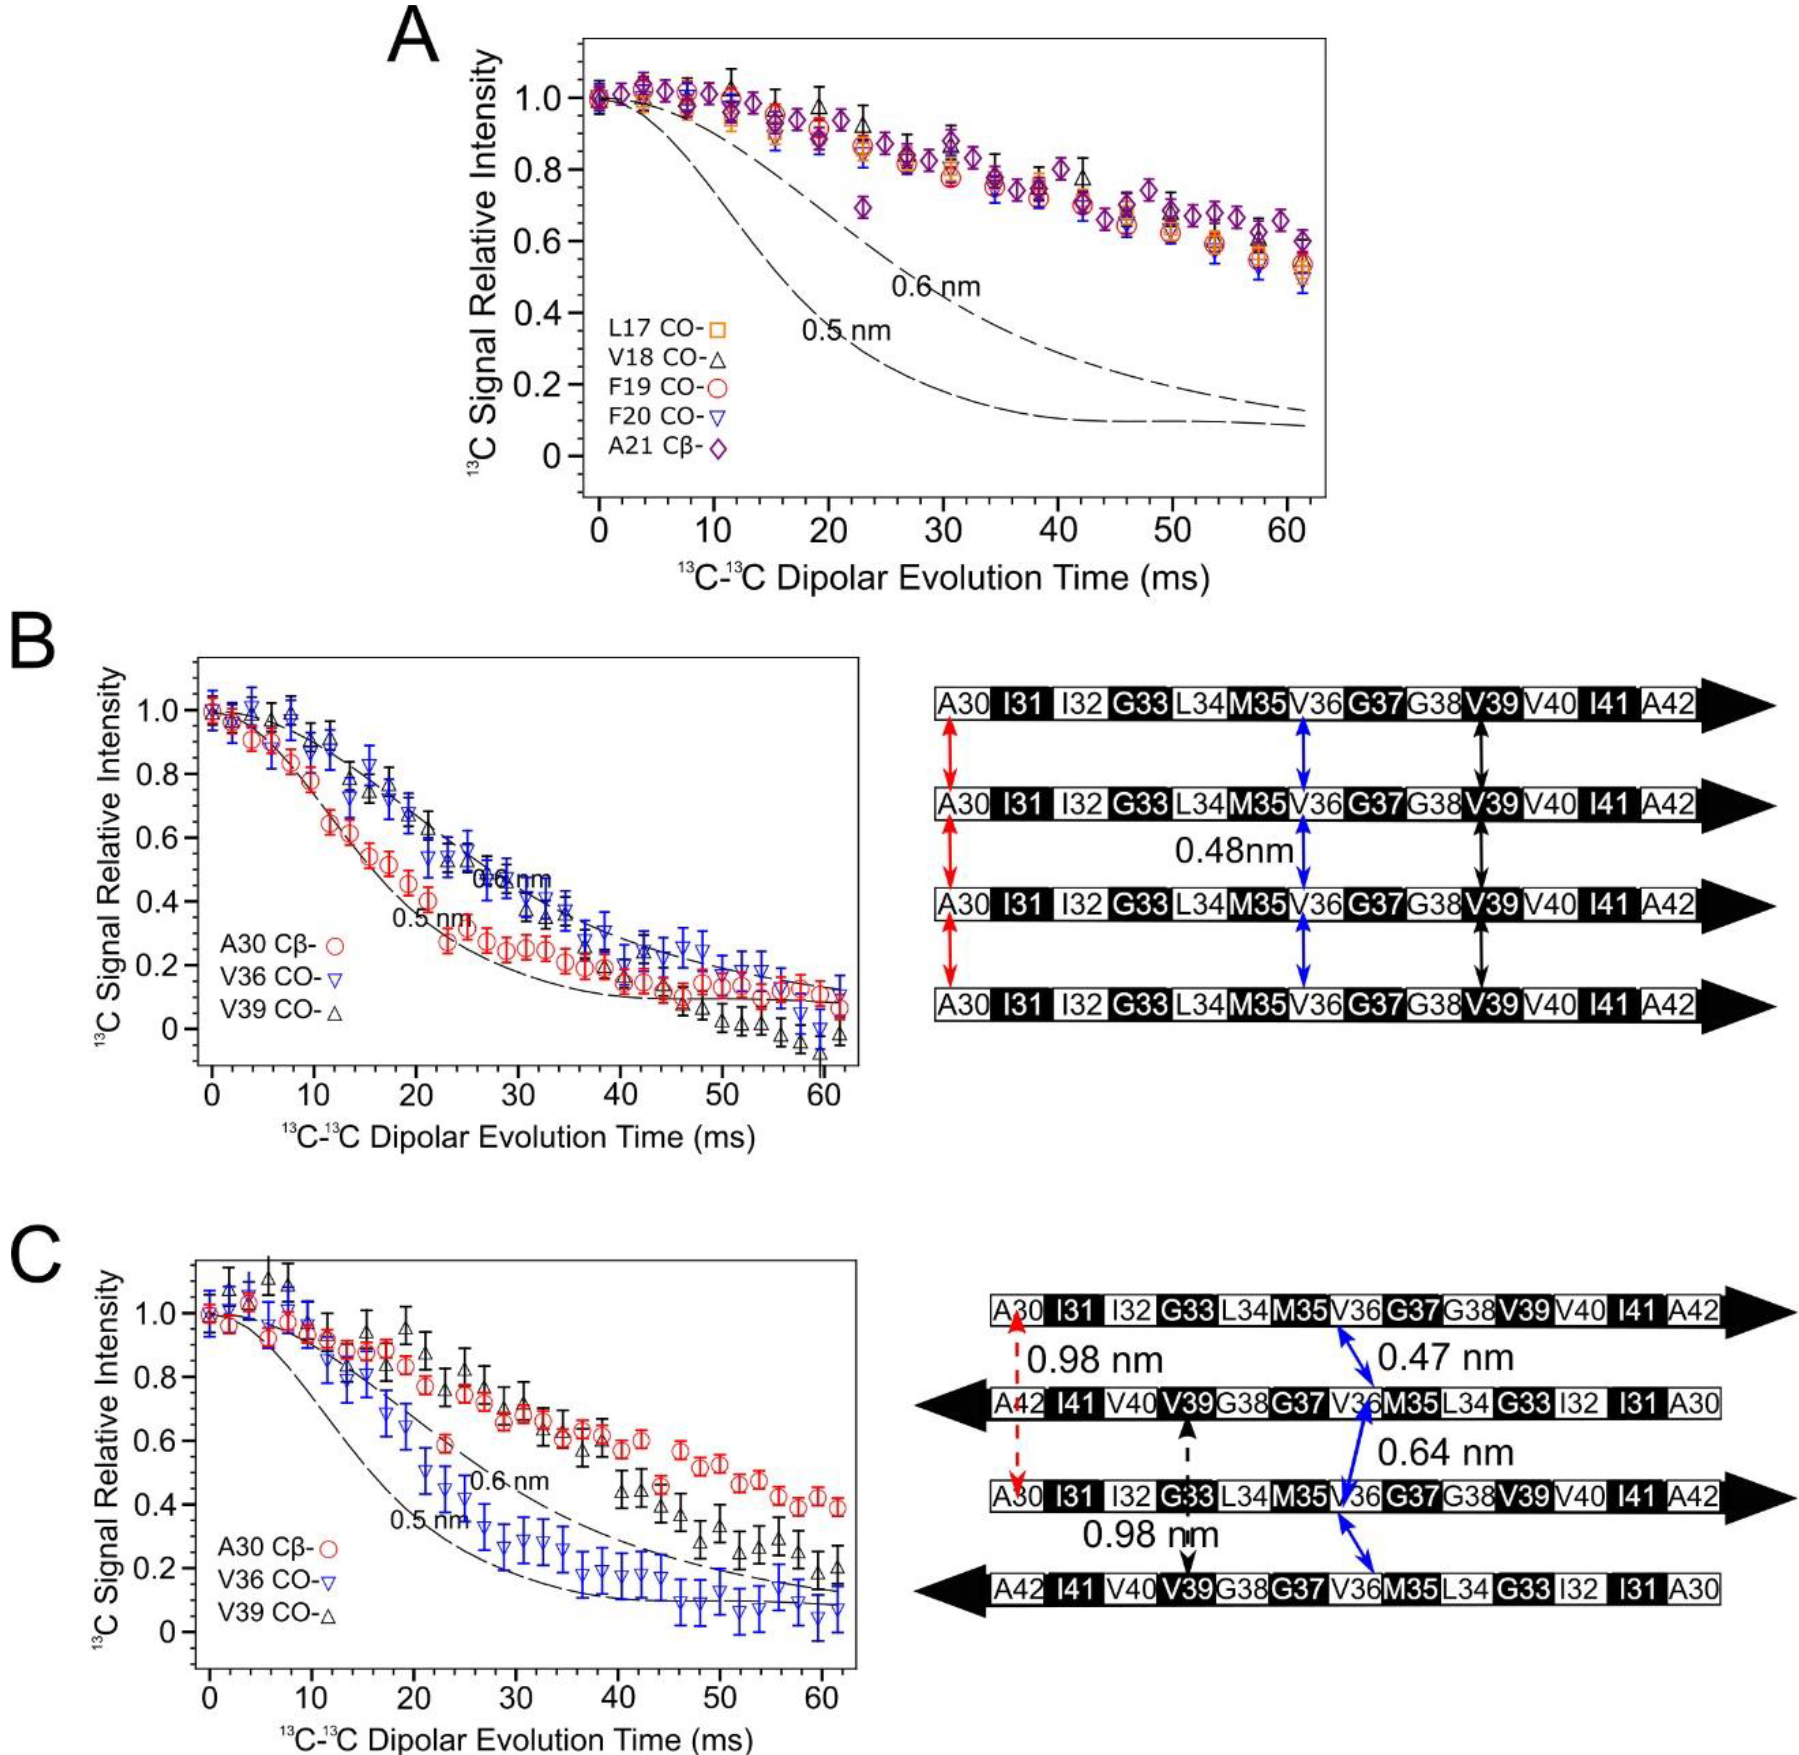
Figure 4.

PITHIRDS-CT 13C-13C dipolar recoupling curves rule out an antiparallel alignment of N-strands. A) Curves measured for 150 kDa Aβ(1–42) oligomer samples 13C-labeled at one backbone CO position per molecule within the N-strand (Samples A-E). B) Curves from Aβ(1–42) fibril samples 13C labeled at single near-backbone positions on the C-strand (left) [33] and a schematic of an in-register parallel β-sheet formed by C-strand (right). The black and white coloring for each residue in the β-strand schematic indicate whether each sidechain is above (black) or below (white) the plane of the β-sheet. The double-headed colored arrows indicate the distances between equivalent backbone CO or Cβ sites on adjacent molecules that are short enough (0.6 nm or less) to measurably affect PITHIRDS-CT decays. C) Curves from 150 kDa oligomer samples 13C-labeled at single near-backbone positions on the C-strand (left) [33] and a schematic of an antiparallel C-strand β-sheet (right). Black and white shading on the β-strand schematic is as in Panel B. Since this β-sheet is centered at V36, the CO site of this residue would be the only backbone CO site that would yield a strong PITHIRDS-CT decay if selectively 13C-labeled (double headed arrows with solid line). Distances for other backbone CO sites are too great (e.g., double headed arrows with dashed line). Dashed lines in PITHIRDS-CT panels indicate simulated 13C inter-atomic distances that were calculated for a linear array of eight 13C spins separated by the indicated identical constant distances as outlined in the Methods.
