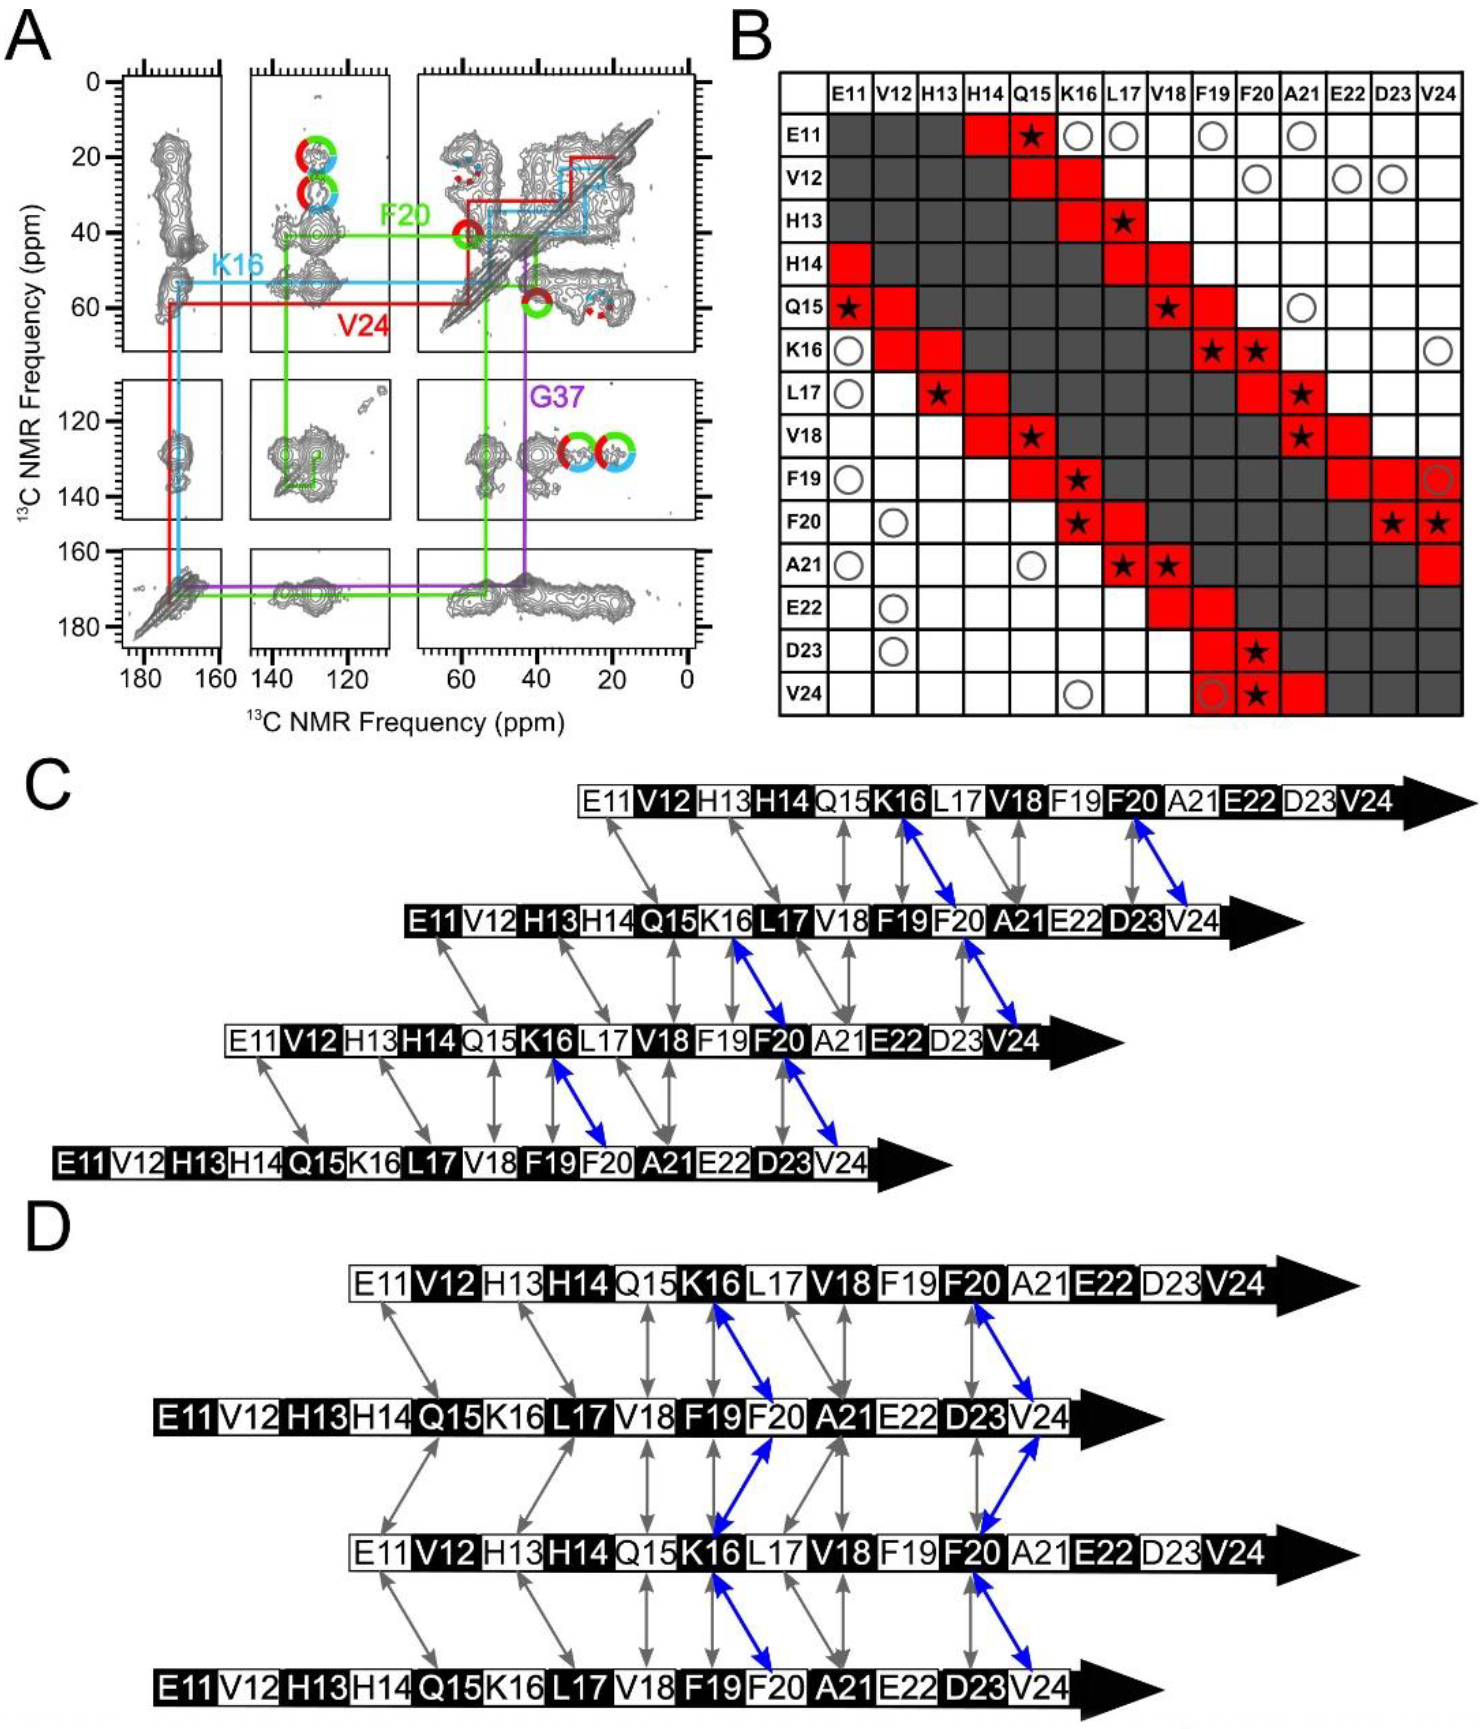
Figure 6.

A parallel N-strand β-sheet shifted three residues out of register was consistent with experimental data. A) A 500 ms 2D-DARR spectrum of Sample 1, which was uniformly 13C-labeled at residues K16, F20, V24 and G37. The colored lines indicate intra-residue cross-peaks, and the multi-colored solid circles indicate observed inter-residue cross-peaks. The multi-colored dotted circles indicate where inter-residue cross-peaks may be anticipated but were not observed (See Figure S10 for slices). B) A contact chart similar to Figure 4B, but with red-colored squares corresponding to predicted 500 ms 2DDARR contacts for Model 3. The star symbols (★) indicate test pairs whose cross-peaks were observed experimentally in 500 ms 2D-DARR spectra collected on samples in which the corresponding residues were both uniformly 13C-labeled. The “O” symbols and gray-shaded squares match their designations in Figure 4B. C) A schematic of Model 3. Black and white shading on the β-strand schematics indicate whether an amino acid sidechain is above or below the plane of the diagram, respectively. D) A schematic of Model ±3. The double-headed arrows in Panels C and D convey the same information as the star symbols in Panel B, and the residue pairs whose cross-peaks are observed in panel A (K16/F20, F20/V24) are highlighted in blue.
