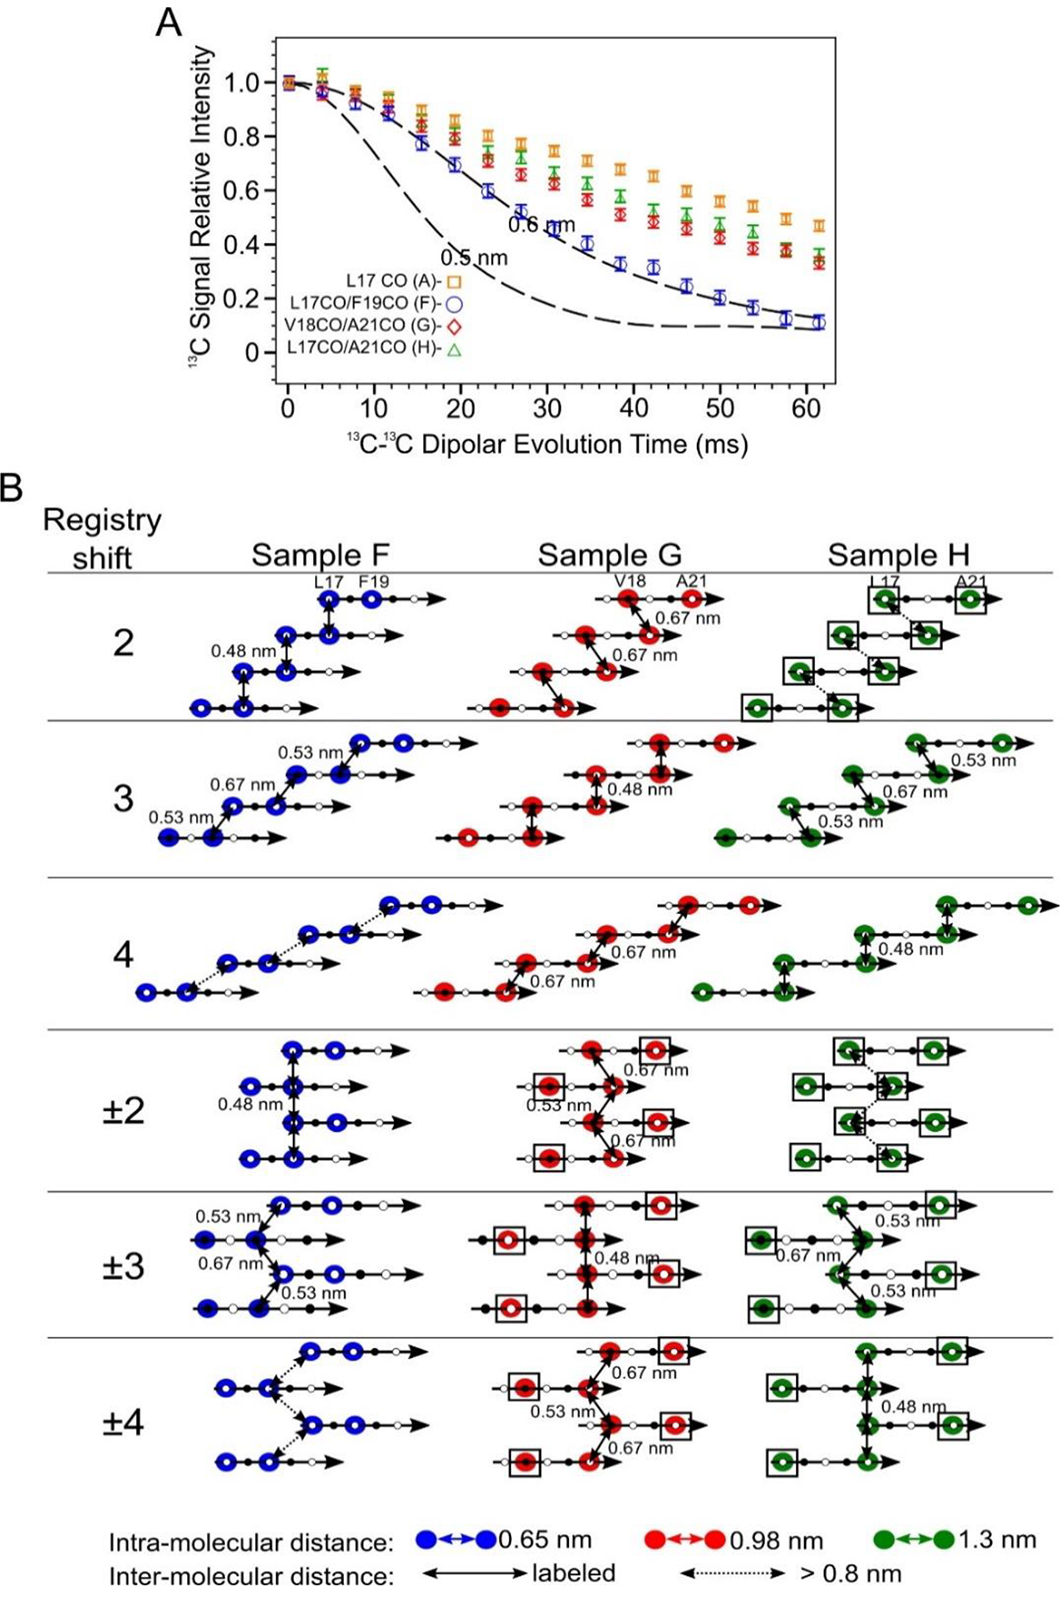
Figure 7.

Doubly 13CO labeled PITHIRDS-CT data indicates out-of-register alignments of the N-strands. A) PITHIRDS-CT data for 150 kDa oligomers 13C-labeled at two backbone CO positions within the N-strand (Samples F, G and H). For comparison, the PITHIRDS-CT curves for Sample A (13C at L17 CO) is also plotted. Dashed lines in Panel A were the same simulated curves as in Figure 3. B) Diagrams illustrating the relative positions of 13C-labeled CO sites for Samples F, G and H, predicted by Models 2, 3, 4, ±2, ±3 and ±4. Colored circles indicate residues in which CO sites are 13C-labeled. Doubled headed arrows indicate 13C-13C distances between the labeled sites. Boxes around circles indicate positions of uncoupled spins.
