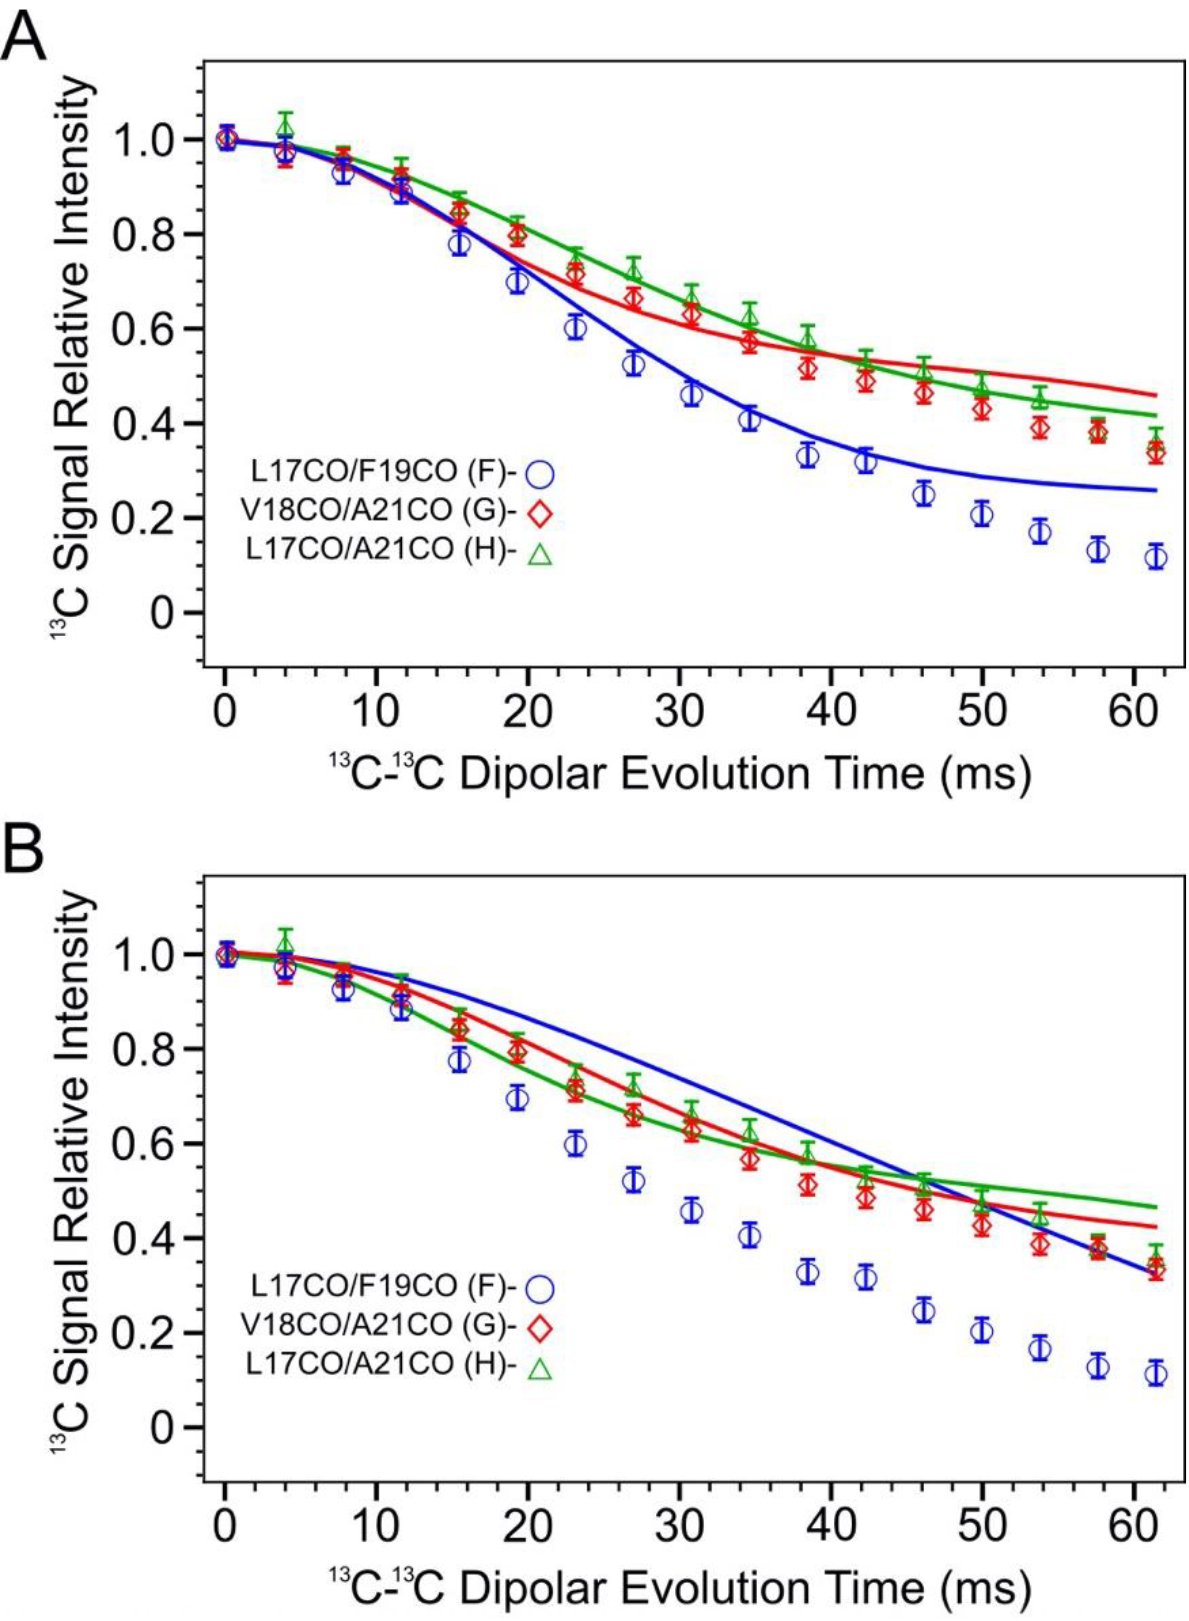
Figure 8.

Simulated PITHIRDS-CT curves and measured data for samples F, G and H according to 13CO atom coordinates in model ±3 (Panel A) and ±4 (Panel B). Each simulated curve has the same color as the corresponding data series (blue: sample F, red: sample G, and green: sample H).
