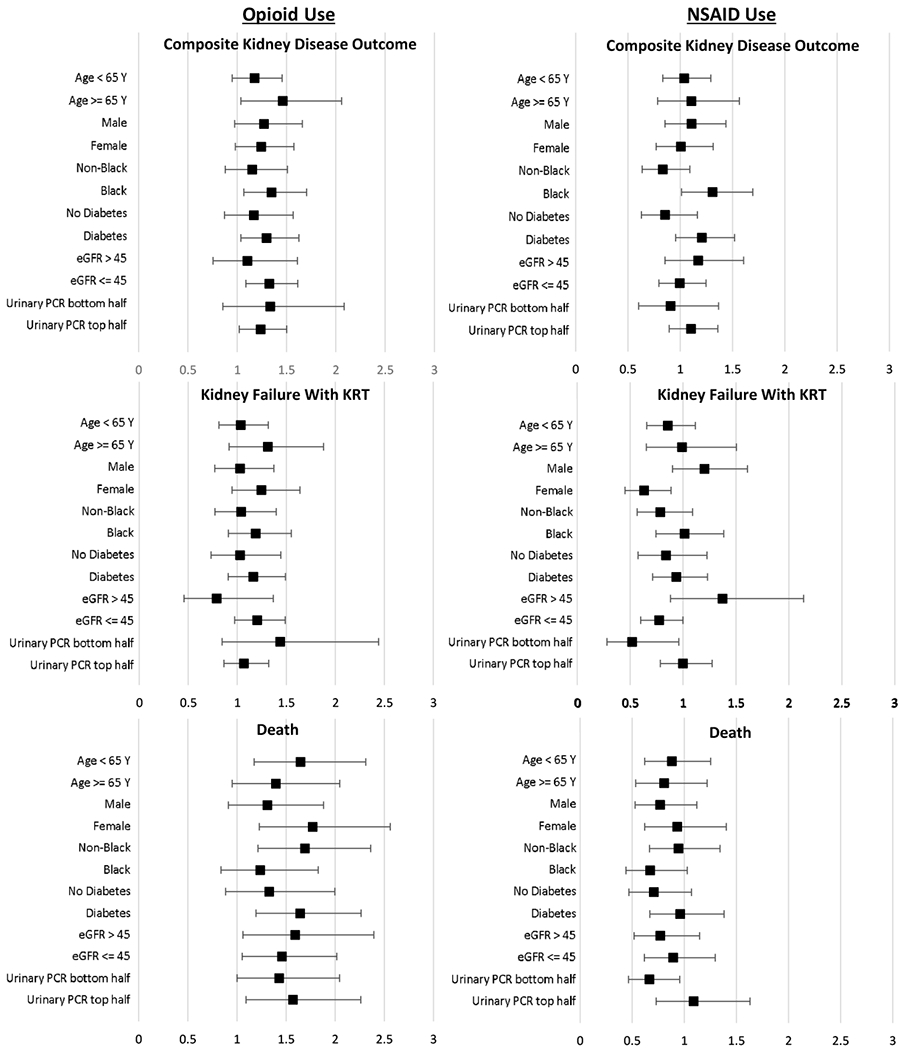
Figure 1.

Forest plots of adjusted hazard ratios of the composite kidney disease outcome, kidney failure with KRT, death, comparing time-updated opioid use in the past versus none, and time-updated NSAID use versus none, stratified by key demographic and case-mix subgroups and adjusted for all other covariates in primary analysis.
