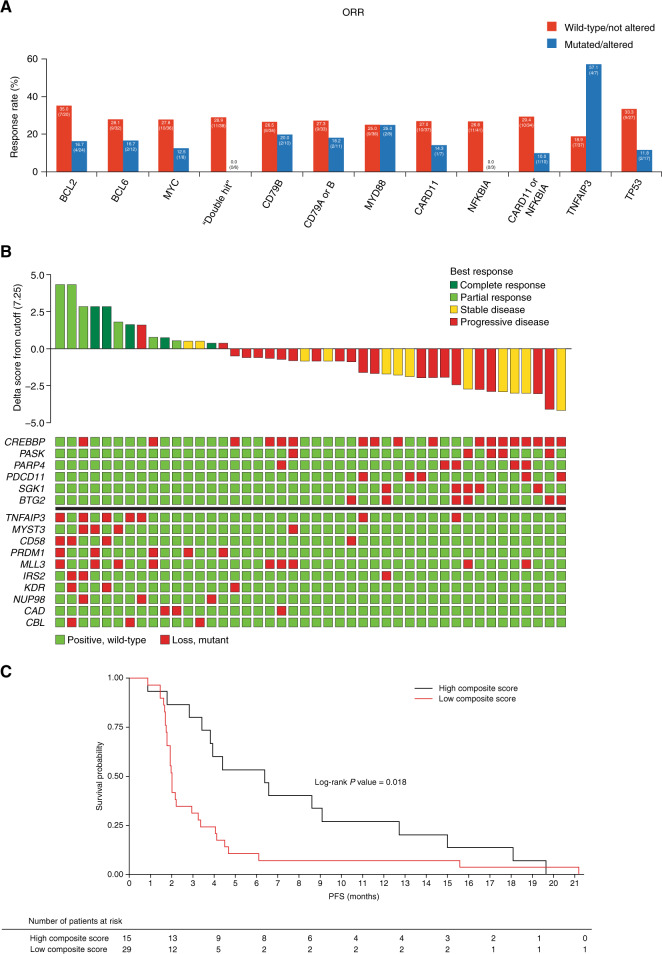
Fig. 4. Correlation of NGS biomarker data with response.
a Correlation of mutational status and clinical outcome (all patients with NGS and response data were analyzed; n = 44). b Multigene mutation signature separating responders from nonresponders and their computed composite scores (patients are sorted based on the composite score. Score values are shown as a waterfall of delta scores to the cutoff level. The list of genes with mutations predictive of response is given in the matrix below the waterfall plot. Genes with the presence of a mutation in the responder group [and absence of mutation in the nonresponder groups] contributing to the score are shown on the bottom, while genes with the absence of a mutation in the responder group [or presence of mutation in the nonresponder group] contributing to the score are shown on top) and c PFS by mutation composite score. NGS next-generation sequencing, ORR objective response rate, PFS progression-free survival.

