Figure 1.
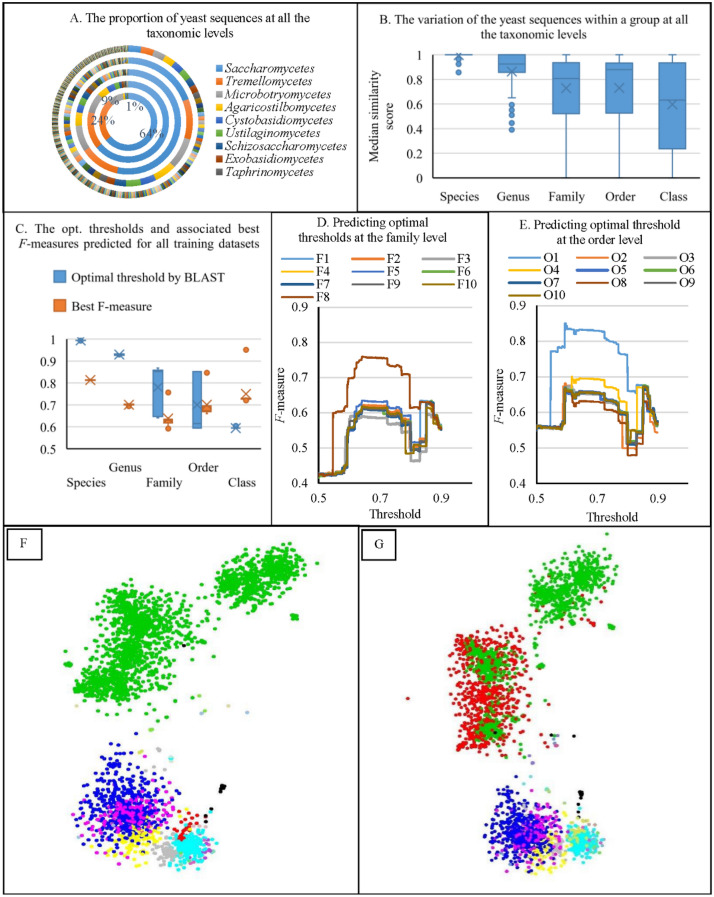
(A) The proportion of yeast sequences at all taxonomic levels. The smallest ring represents the class level, followed by the order, family, genus and species levels. (B) The variation of the median similarity scores of the yeast groups at all taxonomic levels. (C) The optimal thresholds and the associated best F-measures predicted for all yeast training datasets at all taxonomic levels. (D) Predicting optimal thresholds for the yeast training datasets using a series of thresholds (between 0.5 and 0.9, with a step of 0.001) at the family level. (E) Predicting optimal thresholds for the yeast training datasets using a series of thresholds (between 0.5 and 0.9, with a step of 0.001) at the order level. (F) The distribution of the yeast dataset. The sequences were colored based on the order name. The sequences of the largest order Saccharomycetales (2,427) were in green, followed by Tremellales (559) in blue, Sporidiobolales (305) in cyan, Trichosporonales (159) in pink, Filobasidiales (122) in yellow, etc. The coordinators of the sequences were generated using fMLC32. The sequences were visualized using the rgl package in R (https://r-forge.r-project.org/projects/rgl/). The numbers in brackets are the numbers of the sequences in the current group. (G) The sequences were colored as in (F) except that the sequences of the Candida genus (730) were colored in red.

