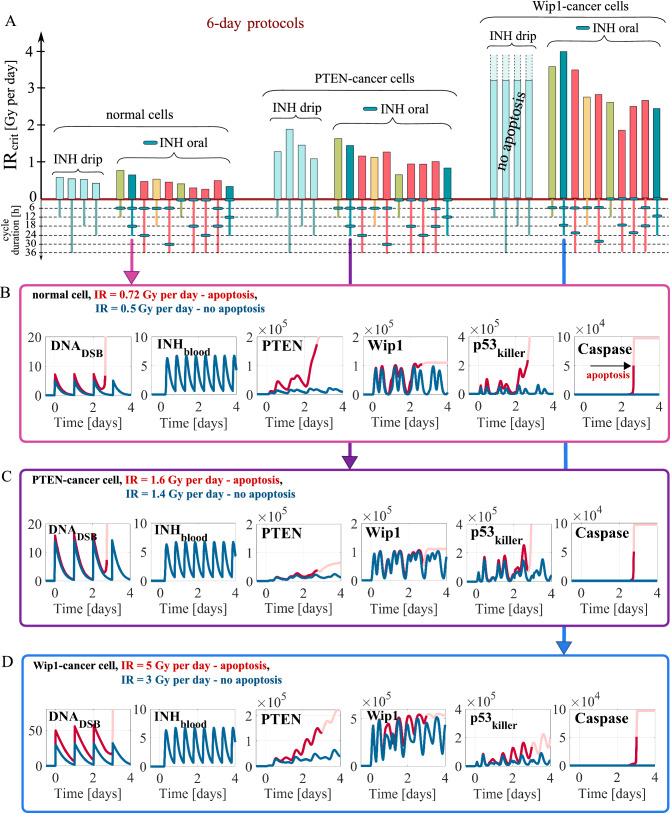
Figure 4.
Critical irradiation doses and simulation trajectories for normal and cancer cells in response to combination therapies. (A) Critical irradiation doses for 6-day protocols after drip and oral inhibitor administration estimated in deterministic model simulations. Different bar colors correspond to different cycle durations, 12 (green), 18 (yellow), 24 (blue) and 36 h (red). Cells are irradiated at the beginning of each cycle, while the inhibitor is administrated at a day dose of 20 IC50 at time points indicated by blue ovals (in the case of oral administration). (B,C,D) Deterministic simulation trajectories for normal, PTEN-cancer and Wip1-cancer cells in response to two irradiation doses, one above (red) and the other below (blue) IRcrit, for the protocol as in Fig. 2. The faded line segments visualize trajectories after the initiation of apoptosis.

