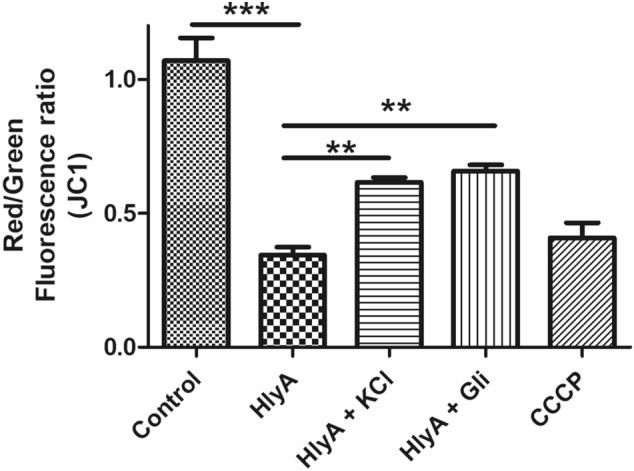
Figure 4.

HlyA induces mitochondrial dysfunction in a potassium dependent manner. The graph shows red/green fluorescence ratio as a measurement of mitochondrial membrane potential (ΔΨm) during various stimulations of THP-1m. Cells were seeded and differentiated in 96-well clear well black plate and then stimulated with HlyA (2 h) alone or in combination with 30 min pretreatment of cells by 100 μM glibenclamide (Gli) and 140 mM KCl as indicated, followed by staining with JC1 dye for 30 min. JC1 remains as a monomer in the cytoplasm, where it gives a green fluorescence, while on its directional uptake inside the mitochondria, promoted by membrane potential, leads to the formation of JC1 aggregates, which fluoresce at red fluorescence. Fluorescence was taken at Ex 485 and Em 530 for green aggregates and Ex 488 and Em 590 for red aggregates. The graph shows decreased mitochondrial membrane potential (ΔΨm) during HlyA stimulation, whereas in the case of pretreatment with Gli and KCl along with HlyA stimulation, ΔΨm was increased. Comparisons between multiple groups were made using one-way ANOVA with Bonferroni’s post test. P value is shown as **p ≤ 0.01, ***p ≤ 0.001.
