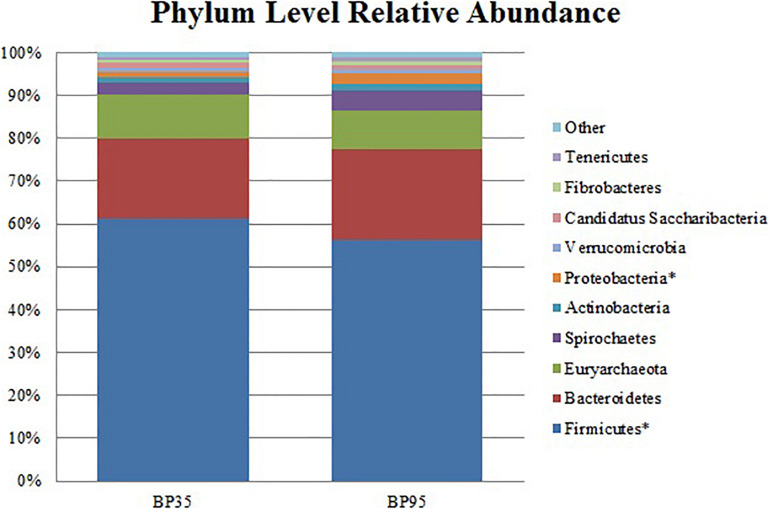
FIGURE 2.
Stack plot comparing the differences, between diets, in the relative abundances of the ten most abundant microbes at the phylum level. Asterisk (∗) signifies phyla with a significantly different relative abundance between diets. BP35 = Concentrate formulated with 35% by-product. BP95 = Concentrate formulated with 95% by-product.

