
4.
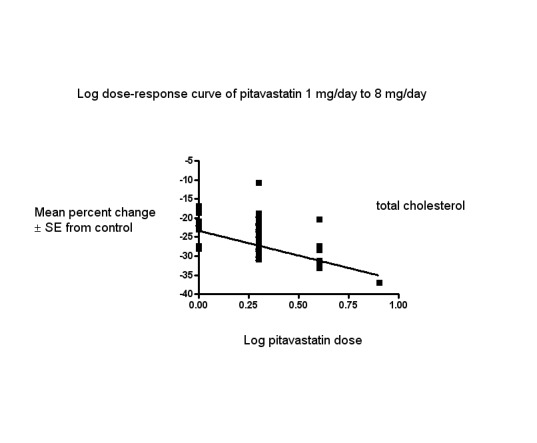
Log dose pitavastatin response curve for total cholesterol
Values represent the results of each trial for each dose comparison. The standard error bars cannot be seen because they all lie within the points
Official websites use .gov
A
.gov website belongs to an official
government organization in the United States.
Secure .gov websites use HTTPS
A lock (
) or https:// means you've safely
connected to the .gov website. Share sensitive
information only on official, secure websites.
Log dose pitavastatin response curve for total cholesterol
Values represent the results of each trial for each dose comparison. The standard error bars cannot be seen because they all lie within the points